3. Data & Evaluation Toolkit: Collecting the Data
Last Updated: 5/13/25
How To Use This Section:
Review different data types, sources, and collection strategies, and understand why data type matters for analysis purposes.
How is data categorized?
After establishing the key question, use cases, and audiences of a project, the next step is to identify (1) what data will be used in the analysis and (2) how the data will be collected. This section provides background on selecting types of data, levels of measurement, and sources of data, to provide context for answering these two questions. It is important to note that data collection strategies, measurement options, and analysis techniques vary depending on the types of data selected for the analysis.
To start, there are two types of data: quantitative and qualitative.
Quantitative data is information that can be counted or measured and is expressed numerically. Examples of quantitative data include:
- A client’s age
- A client’s total income
- The date a case was closed
Qualitative data is information that is expressed through text, rather than numbers. Examples of qualitative data include:
- A client’s gender
- The types of income a client receives
- The types of service provided on a closed case
- A client’s comments on the service they received
Both quantitative and qualitative data can be analyzed, but the available analysis techniques will vary. Analysis may rely on quantitative data, qualitative data, or both (i.e., mixed methods). There is a large body of research around the different strengths and tradeoffs for each type of data, which is beyond the scope of this toolkit. To learn more, both McGill University and Eastern Michigan University have resources that dive deeper into the differences around quantitative and qualitative research.
How is data collected?
Legal aid organizations often already have a wealth of data at their disposal, such as:
- Case Data
- Client Data
- Timekeeping Data
- Payroll Data
- Grant Data
These data sources may be on-hand and useful for some data analysis projects. For other projects, new data may be needed to be able to address the key question. New data might be needed because this information was never collected previously, is outdated or incomplete, or was not collected in a way that aligns with the needs for the current project.
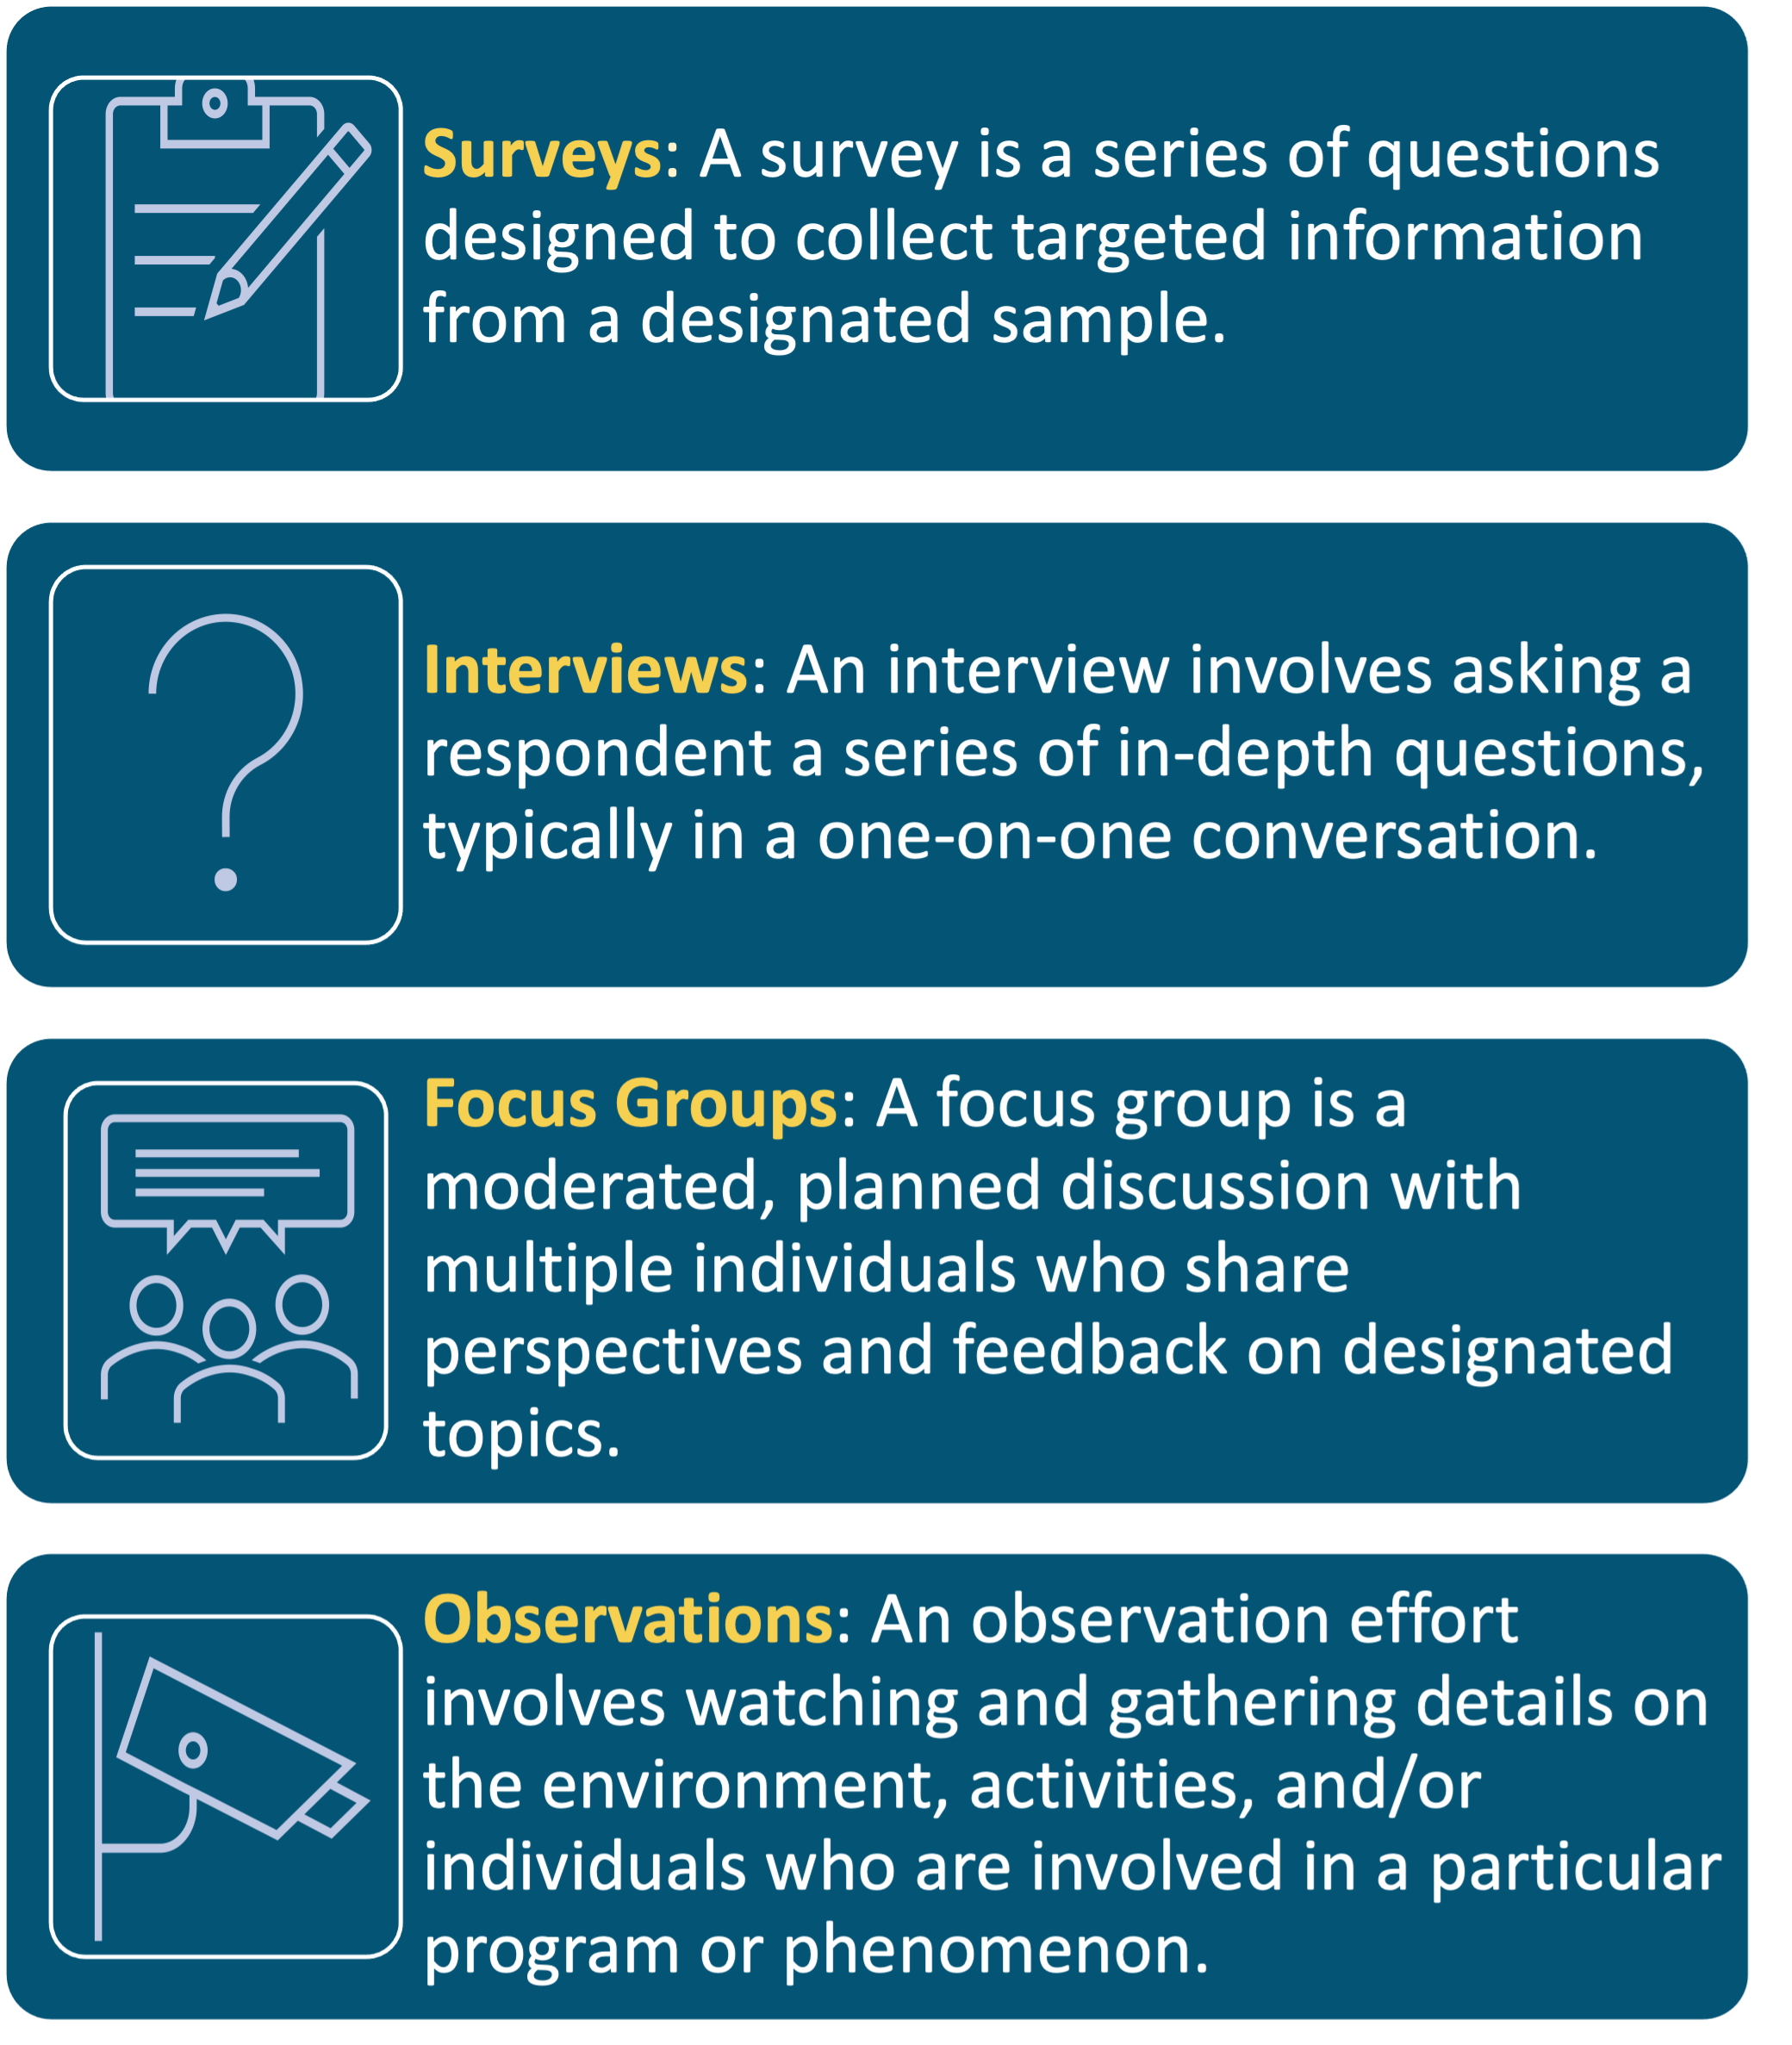
There are many strategies for collecting new data, including though:

For example, say a legal aid provider is interested in collecting feedback from applicants who use an online intake form to request assistance. Feedback was not collected previously, so the provider may choose to use any or all of the above strategies to gather this new data, such as by:
- Adding a survey after online intakes are submitted for applicants to share feedback on their experience,
- Conducting one-on-one interviews with applicants to discuss pain points with the application process,
- Facilitating discussions with a focus group of applicants on the online intake process, or
- Observing applicants as they navigate through the online intake process
Both quantitative and qualitative data can be collected through the above methods. However, the way data collection is structured may change depending on whether the aim is to produce quantitative or qualitative data. For example, the online application feedback survey might contain a question asking the applicant to estimate how many minutes it took for them to complete the application (quantitative data). That same survey might also have an open-text question asking the client for comments or suggestions about the application process (qualitative data).
When selecting data collection strategies for a project, stakeholders involved in the decision will usually have to balance a need for high-quality data with cost, timing, and other resource constraints. The Center for Disease Control and Prevention offers guidance on various strengths and weaknesses for each of these data collection methods. Expanded definitions of these data collection strategies can be found in the International Organization for Migration’s Methodologies for Data Collection and Analysis guide and the Urban Institute’s Data Collection project.
In addition to new data and data that organizations have on-hand, data analysis projects might use publicly available datasets from government agencies, courts, published research, and other external sources. As an example, Census Bureau datasets might be used to better understand the poverty levels and demographics of the communities in which a legal aid provider operates. There is a vast array of datasets accessible to the public, from sources such as:
- Research and data resources from the Legal Services Corporation
- Federal agencies like the Bureau of Economic Analysis and the National Center for Education Statistics
- State-specific data portals like the California Open Data Portal, Iowa Data, Michigan’s Open Data Portal, and the Texas Open Data Portal
- City-specific data portals like NYC Open Data, Los Angeles Open Data, and Chicago Open Data Portal
As part of the Justice in Government Project Toolkit, the National Legal Aid and Defender Association maintains a resource on many of these public datasets that may be useful for legal aid providers and researchers.
Whether new or existing data (or both) is appropriate to use will vary based on the purpose of the analysis. Collecting new data may be relatively more expensive and time consuming than using existing data, but new data is often necessary to gather the information needed to properly address a project’s key question. This step in the project lifecycle could take days, months, or even years depending on what data is needed and the selected data collection processes.
How is data measured?
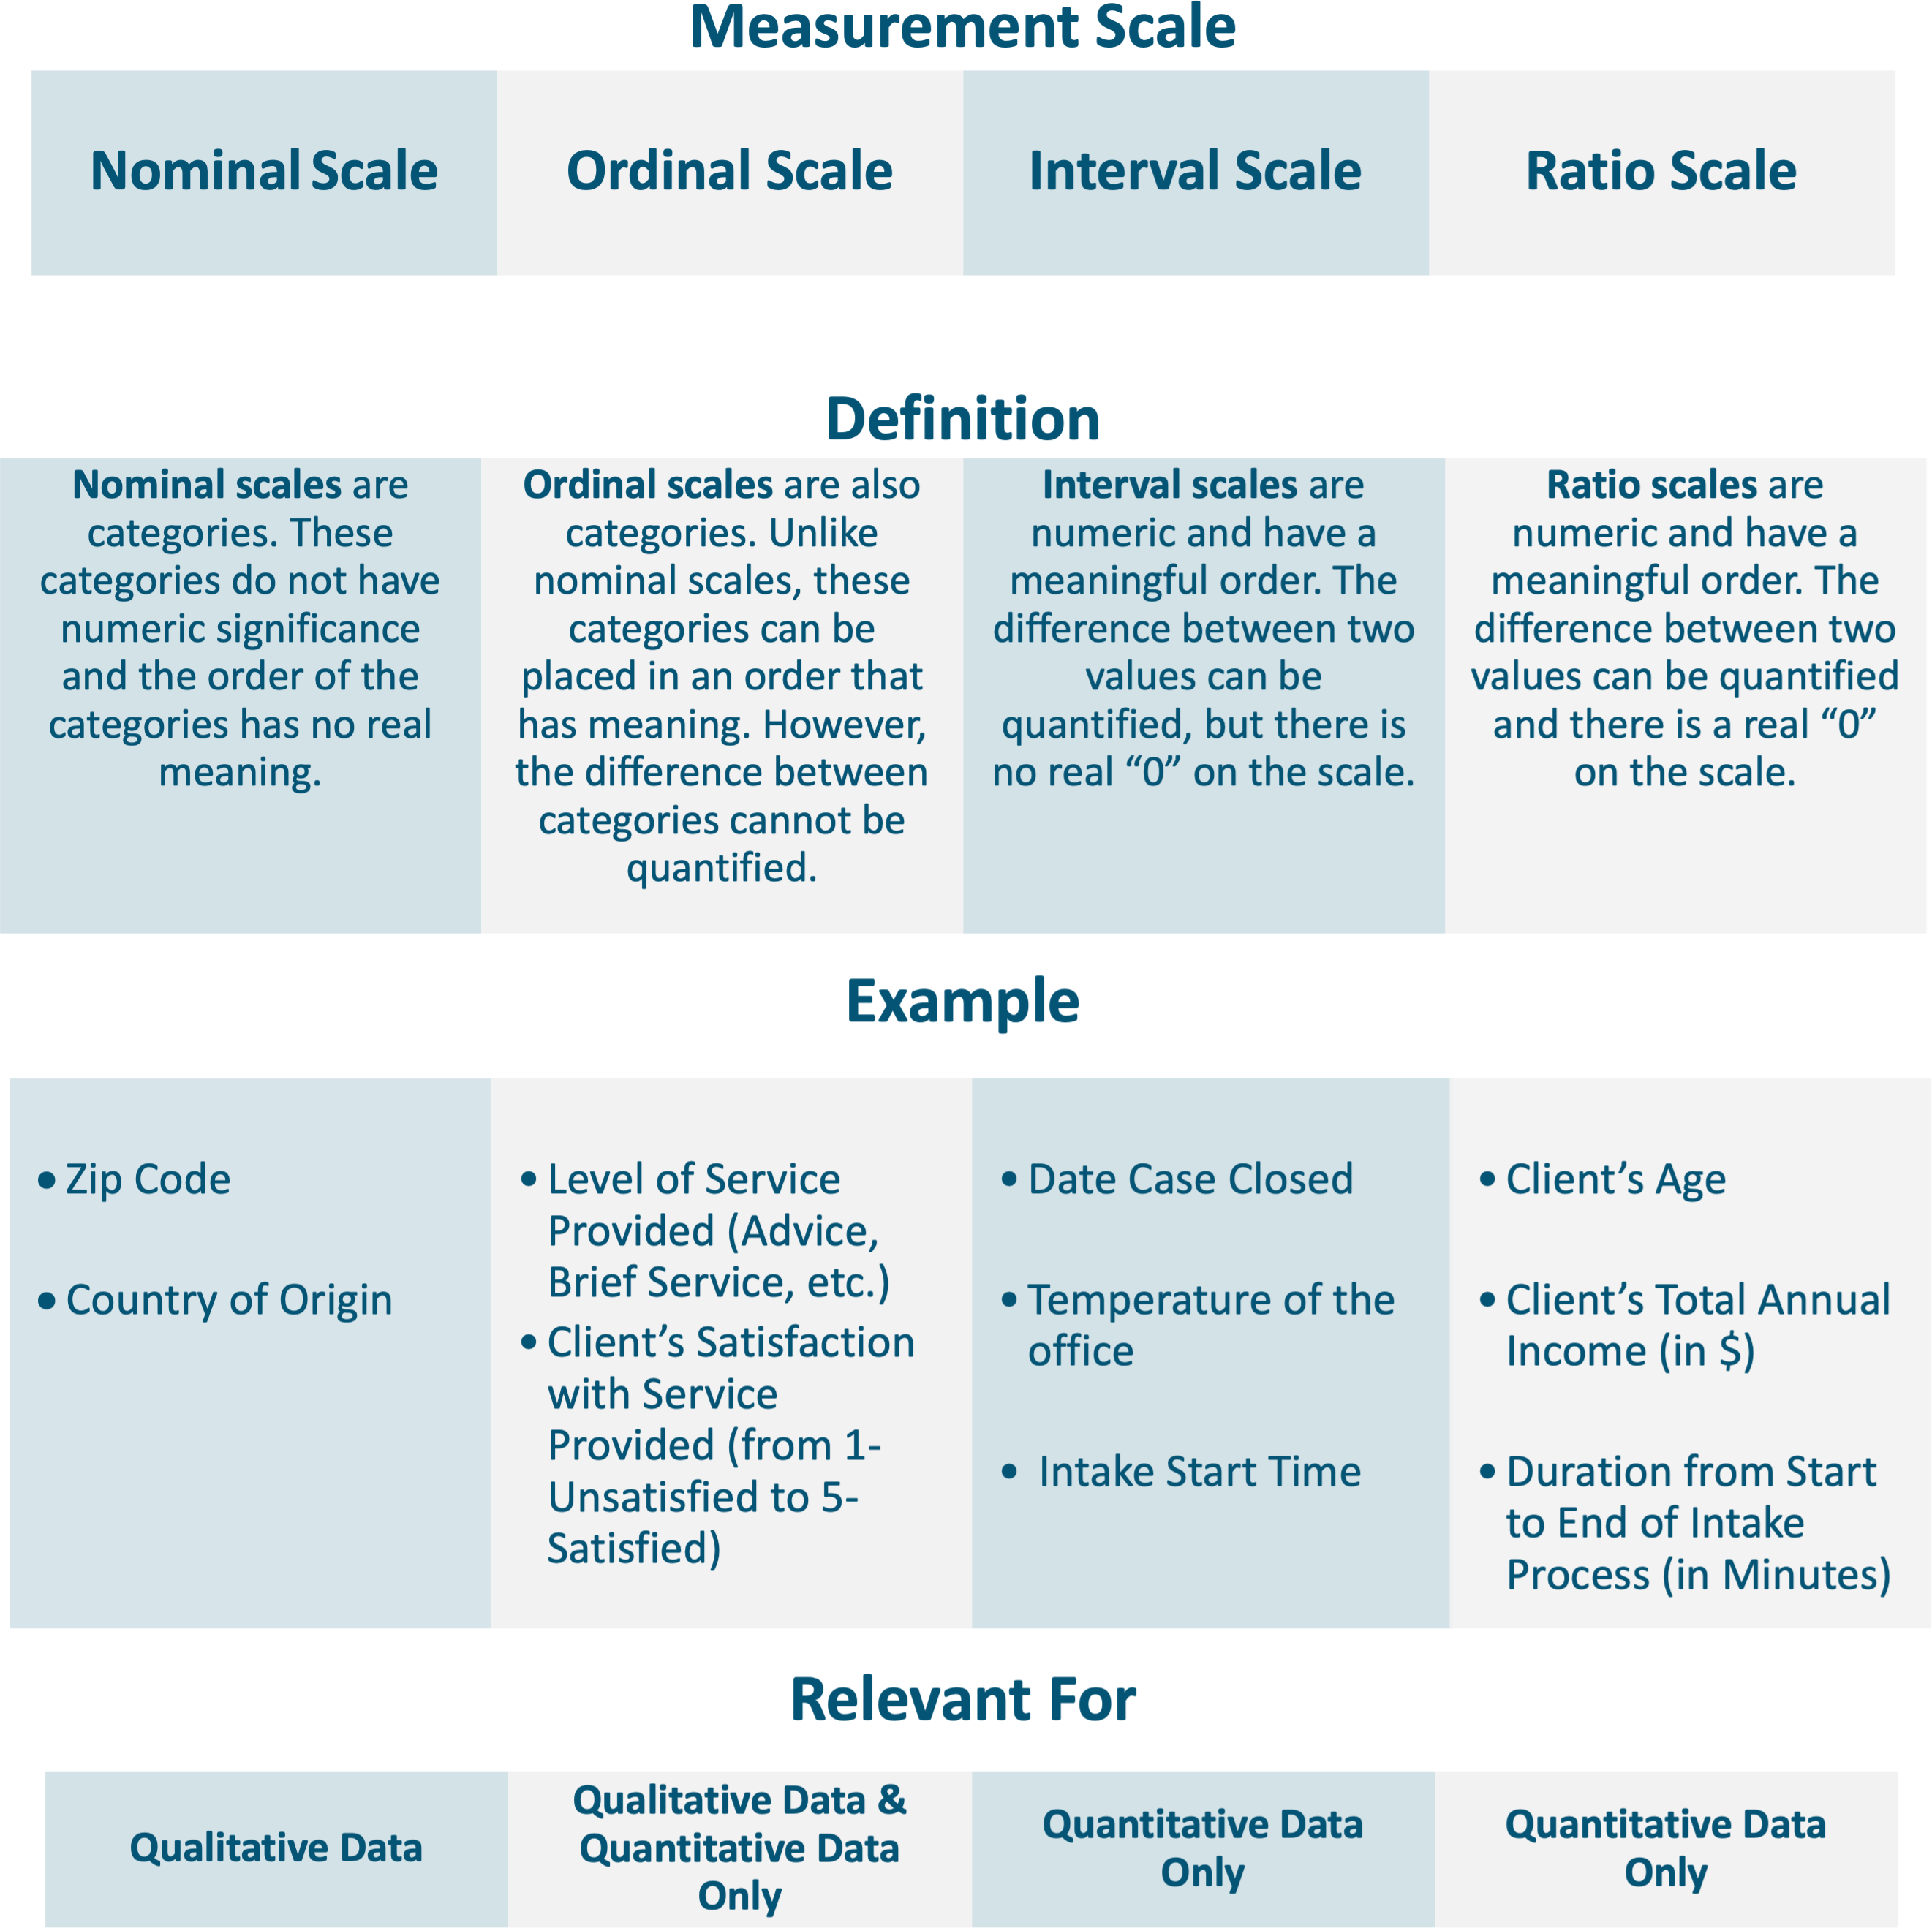
Levels of measurement (I.e., Nominal, Ordinal, Interval, and Ratio) are different types of scales that explain how values for a particular data point relate to one another. A data point can be sorted into one of the four level of measurement scales, which determines the available options for how that data point can be analyzed. Listed below are definitions of the four measurement scales and examples of data points that align with each scale:

Why do data types and levels of measurement matter?
Levels of measurement impact which types of analysis are feasible and how an analysis can best be visualized. Certain methods of analysis are not possible for all levels of measurement; this point will be reviewed in greater detail in the next section.
Practically speaking, levels of measurement (i.e., Nominal, Ordinal, Interval, and Ratio) influence the data selection process. This is because data needs to be collected in ways that align with multiple factors including the needs of the audience and the use cases for the analysis.
Let’s look at two examples of why levels of measurement matter for data analysis projects and why it is important to be thoughtful around designing data collection efforts.
Example 1: A Grants Manager at a legal aid organization needs to know the average age of clients served in the past calendar year, to include this in a new grant application. If the organization collects the client’s age in years (26, 35, etc.), the Grants Manager could determine the average client age because this uses a ratio scale. However, the Grants Manager would not be able to calculate this average if client age is collected using an age range (0-17, 18-29, etc.) because this uses an ordinal scale.
Example 2: A legal aid ED wants to know whether caseloads are distributed evenly across attorneys at their organization. The ED could examine the total number of cases closed by each attorney in the past year. However, on further reflection, the ED will realize that the total number of cases (I.e., one data point) alone does not paint the whole picture because attorney involvement is impacted by case attributes, such as the legal issue, level of service provided, and case complexity. Knowing this, the ED may want to break the analysis down further, perhaps by examining the following data:
- Legal Issue: This is measured on a nominal scale; these values cannot be ordered in a meaningful way. The ED could track total cases by legal issue (frequency) and most common case type (mode) for each attorney. However, the ED could not determine the mean legal issue for each attorney.
- Level of Service Provided: This is measured on an ordinal scale; these values are not numeric but could be ordered by intensity (from advice to full representation). The ED could track total cases by service level (frequency), most common service level (mode), and what the middle service level is (median). However, the ED still could not determine an attorney’s mean level of service.
- Duration Between Open and Close Date (in Days): This is measured on a ratio scale; these values are numeric and there is true zero on the scale. Like Legal Issue and Level of Service, the ED could track the frequency, mode, and median for each attorney relating to case duration. The ED could also track the average case duration (mean) and the distribution of cases by duration (standard deviation), for each attorney.
To make quick comparisons, the ED may want to review only a couple metrics, such as each attorney’s total closed case count and average case duration from open to close. However, if the ED wants to dive deeper into the data, they may look for analysis grouped by legal issue, level of service provided, or other case and client attributes.
To summarize, when establishing what data points will help in answering the key question, keep in mind equitable and ethical ways to collect the data (see Data Equity section above for related resources), how the data can be analyzed, and whether the structure of data collection aligns with analysis needs.
Once all data collection activities have been completed, the project can move forward into the preparation and analysis phase, which is discussed in the next section of this toolkit.


