
Geographic Concentration
Description
Definition: Geographic concentration analysis compares high or low concentrations of multiple variables to understand how location impacts client conditions. It often uses location quotients (LQs) to quantify concentrations.
Purpose: Highlights areas where services could be ramped up to better meet client need, and pinpoints "hotspots" or regions with specific emerging needs or resources.
Examples:
- Identifying neighborhoods with higher-than-expected concentrations of eviction cases.
- Comparing service levels with poverty concentrations across regions.
Key Insight: Concentration analysis reveals the interplay between variables and locations, helping you understand how geographic factors influence service needs or outcomes.
Example Data Question
Are there parts of our service area that are disproportionately poor? In other words, are there parts of our service area with a higher share of the poverty population than share of the total population? (e.g. Are there any counties in the Community Legal Services of Arizona service area that are disproportionately poor?)

Recreate This Analysis
Data Sources
U.S. Census American Community Survey data at Census Bureau Data
- S1701 Poverty Status in the Past 12 Months
- Contents: Poverty (<100%) counts and percentages by age, sex, race, educational attainment, employment status, and work experience, and population totals by poverty at various levels (including <125%, <200%, etc.).
- Data Limitation: This table does not provide detailed demographic characteristics about the <125% poverty level population, but it does have data for all 5 counties, including counties with small populations.
Example Analyses Steps
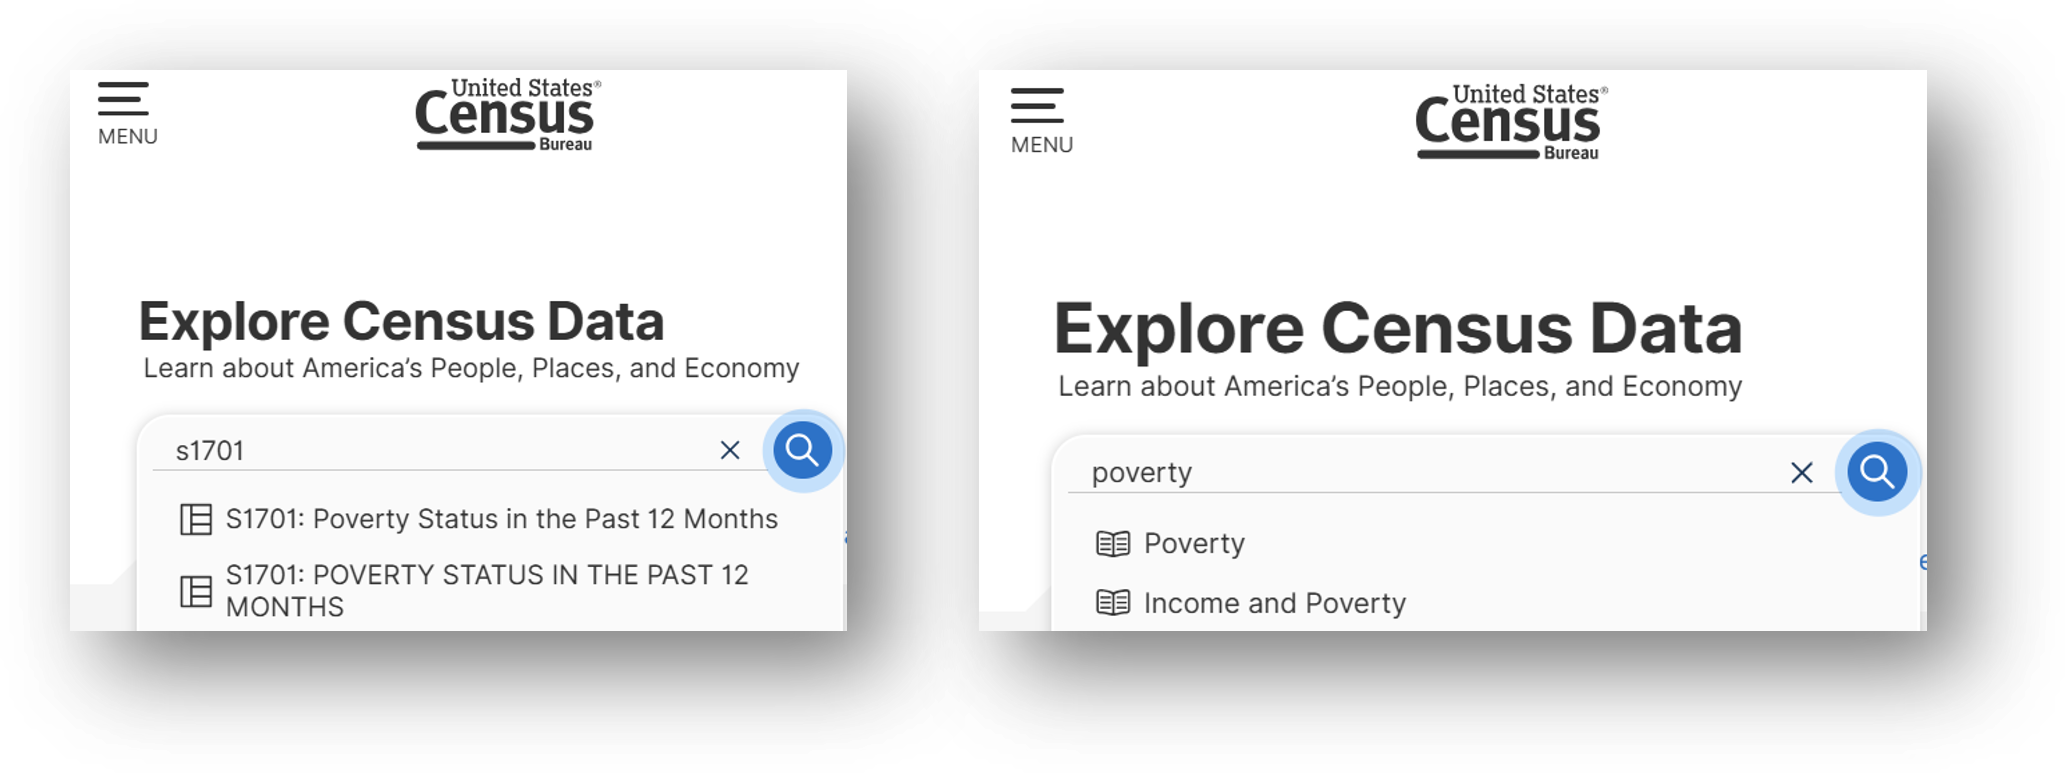
- Open the Census Bureau's Explore Census Data website.
- Type "s1701" in the search bar for our example.
- In the future, if you know you need the S1701 Poverty Status in the Past 12 Months table, type "s1701" in the search bar. If you do not know the table name, you may enter a search term, such as "poverty" to be taken to a list of relevant tables, including S1701.
- Click on the S1701 table.
- Click on +View All 25 Products under the table name.
- Click on 2023: ACS 5-Year Estimates Subject Tables
- If your geographies have populations over 65,000 you may stay with the default 1-Year Estimates, which provide more current, but less reliable data or you may use 5-Year Estimates, which provide less current, but more reliable 5-year averages. If some or all of your geographies have fewer than 65,000 people (like La Paz County, AZ in this example), you must select 5-Year Estimates.
- For information about choosing 5-year or 1-year estimates, refer to Using 1-Year or 5-Year American Community Survey Data.

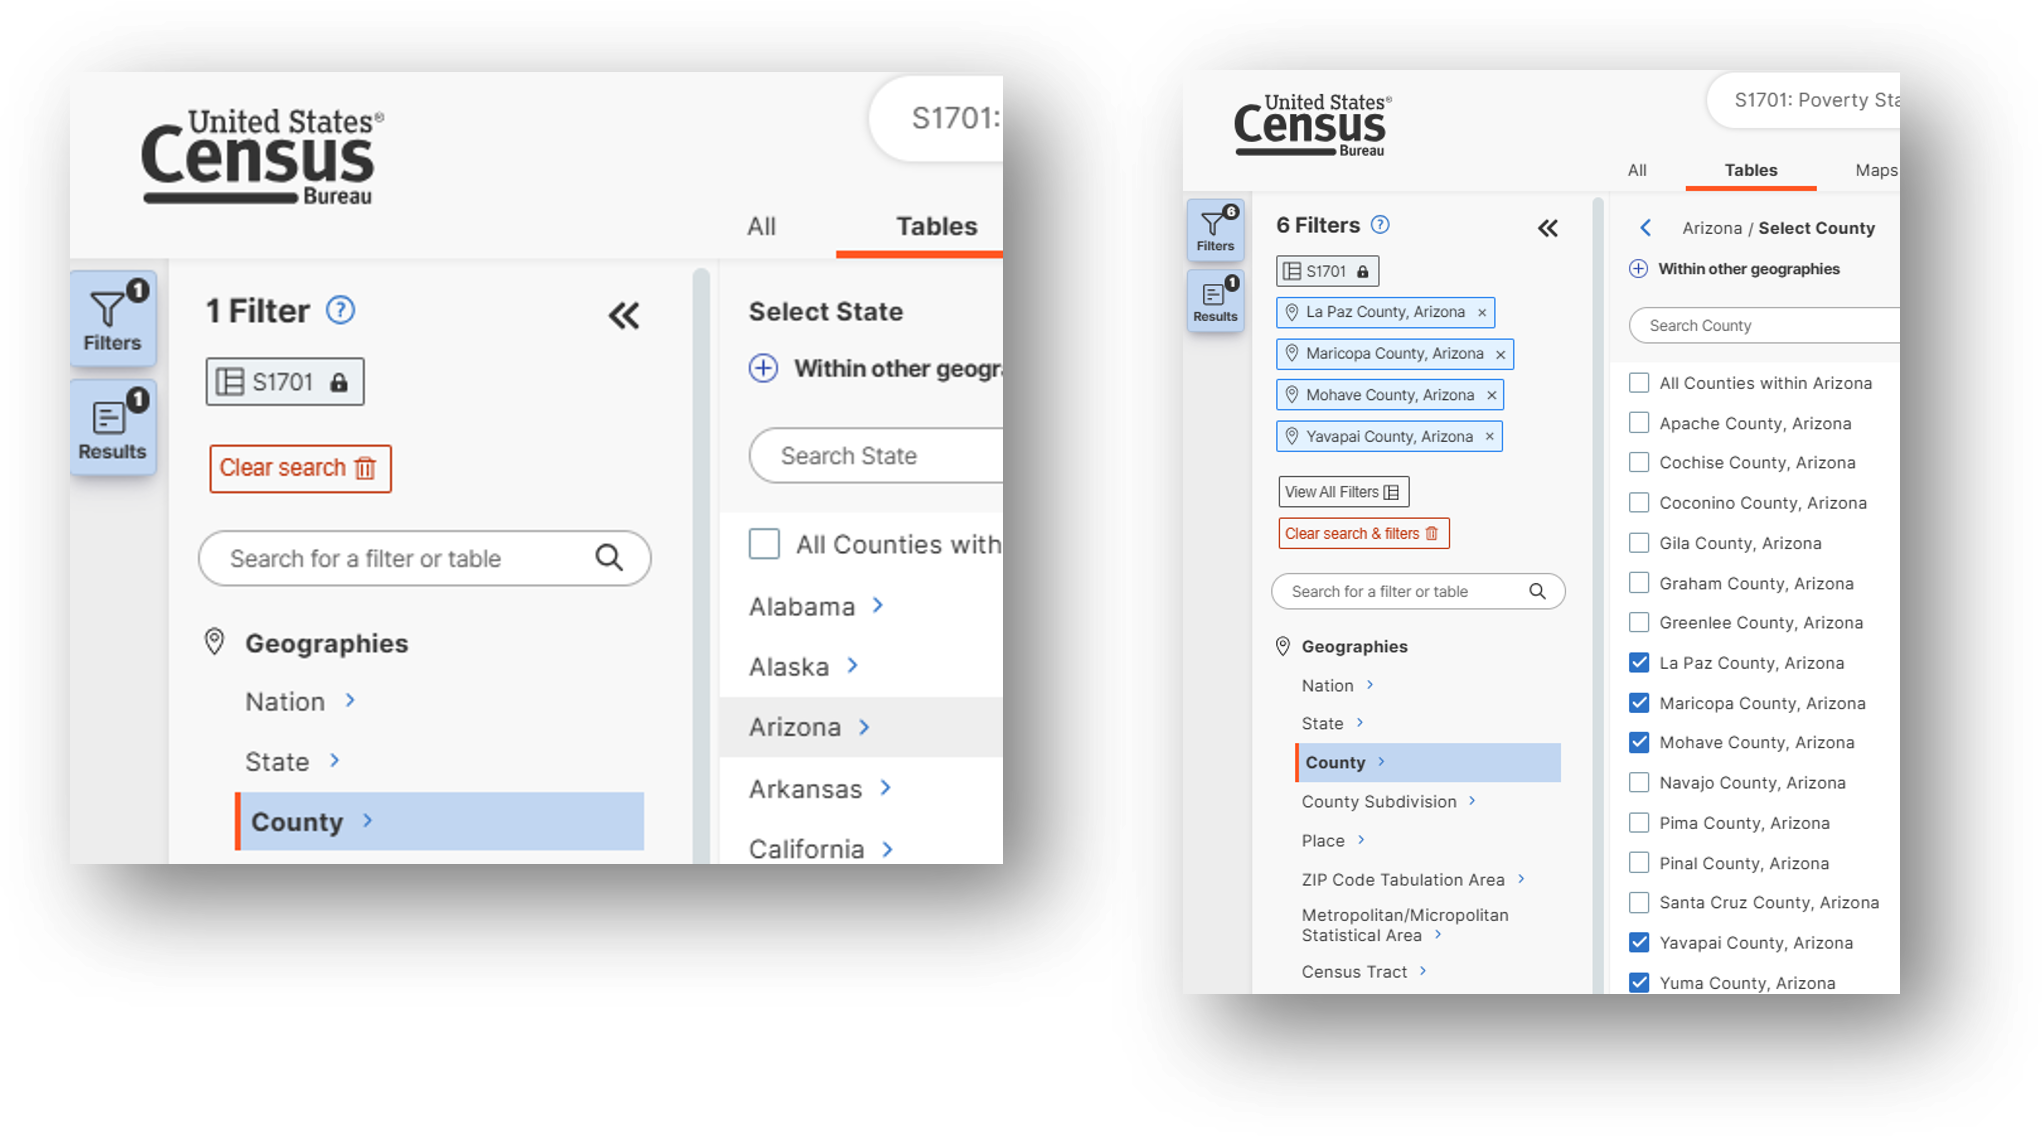
- Under Geographies in the far-left filter panel, select a geographic level, and click on it (In this example: geographic level is County).
- Select a state (Arizona in this example).
- Click on a county (in this example, Clayton County) then click on All Census Tracts within County (in this example, All the Census Tracts in Clayton County).
- Click on the county name at the top to be taken back to the list of all counties in your service area.
- Repeat Steps 8 & 9 until you have added Census Tracts for all the counties in your service area (5 Arizona counties were selected in this example: La Paz, Maricopa, Mohave, Yavapai, & Yuma).
- Once all geographies have been added, click on close panel << button.
- Verify that 5-Year Estimates are still indicated under the table name in the top left and if instead 1-Year Estimates are indicated, click on the Dataset button and reselect 2023 5-Year Estimates (to ensure that La Paz county data are included in this example).
- To avoid downloading the Margin of Error data, click on the Margin of Error button along the top ribbon before downloading the data.
- Click on the Excel button along the table ribbon to download an Excel version of the table or the CSV button to download a CSV version of the table. If you do not see the Excel or CSV buttons in the top ribbon, click on More Tools at the far right of the ribbon.
- The Excel version is formatted to be more user-friendly and includes an Information tab that provides table details and notes whereas the CSV version includes only unformatted data.
- The CSV version can be easier to work with when you are downloading data for more than one geography as long as they are saved as Excel files after being downloaded in CSV format.
- Open the data file:
- If the numbers downloaded in text format, highlight the relevant cells, right click, and select Convert to Number.
- Focus on the top row, Population for whom poverty status is determined (which is the total poverty and non-poverty population combined) and the 125 percent of the poverty level row.
- Perform calculations:
- Copy the county names (making sure to include the word “County” followed by a comma and the name of the state, which is important for the mapping steps below) into a new calculation table to the right of the downloaded data.
- Copy the Population for whom poverty status is determined numbers for each county and the Less than 125 percent of poverty level numbers for each county into the new table.
- Calculate each county’s Share of the Total Population and Share of the <125% Poverty Population by dividing each county's number by the service area total.
- Calculate each county’s Location Quotient by dividing the share of the <125% Poverty Population by its share of the Total Population (in this example, Location Quotients over 1 indicate that the county is disproportionately poor; or has a higher share of the poverty population that expected).
- Create map:
- Highlight the County column (R) and the Location Quotient column (W) and the county rows, excluding the service area total, and click on Insert-Maps-Filled Maps.
- Right-click on the map and select Format Data Series.
- Leave Map projection Automatic but consider changing Map area to Only regions with data. Change Map labels to Show all.
- Change Series Color to Diverging (3-color) and select green, white, and red fill colors.


Related Questions You May Ask
- Does the concentration of eligible populations align with that of specific vulnerable groups?
- How does the geographic concentration of eligible people compare to ineligible (higher income) people?