2. Data & Evaluation Toolkit: Defining the Analysis
Last Updated: 5/07/25


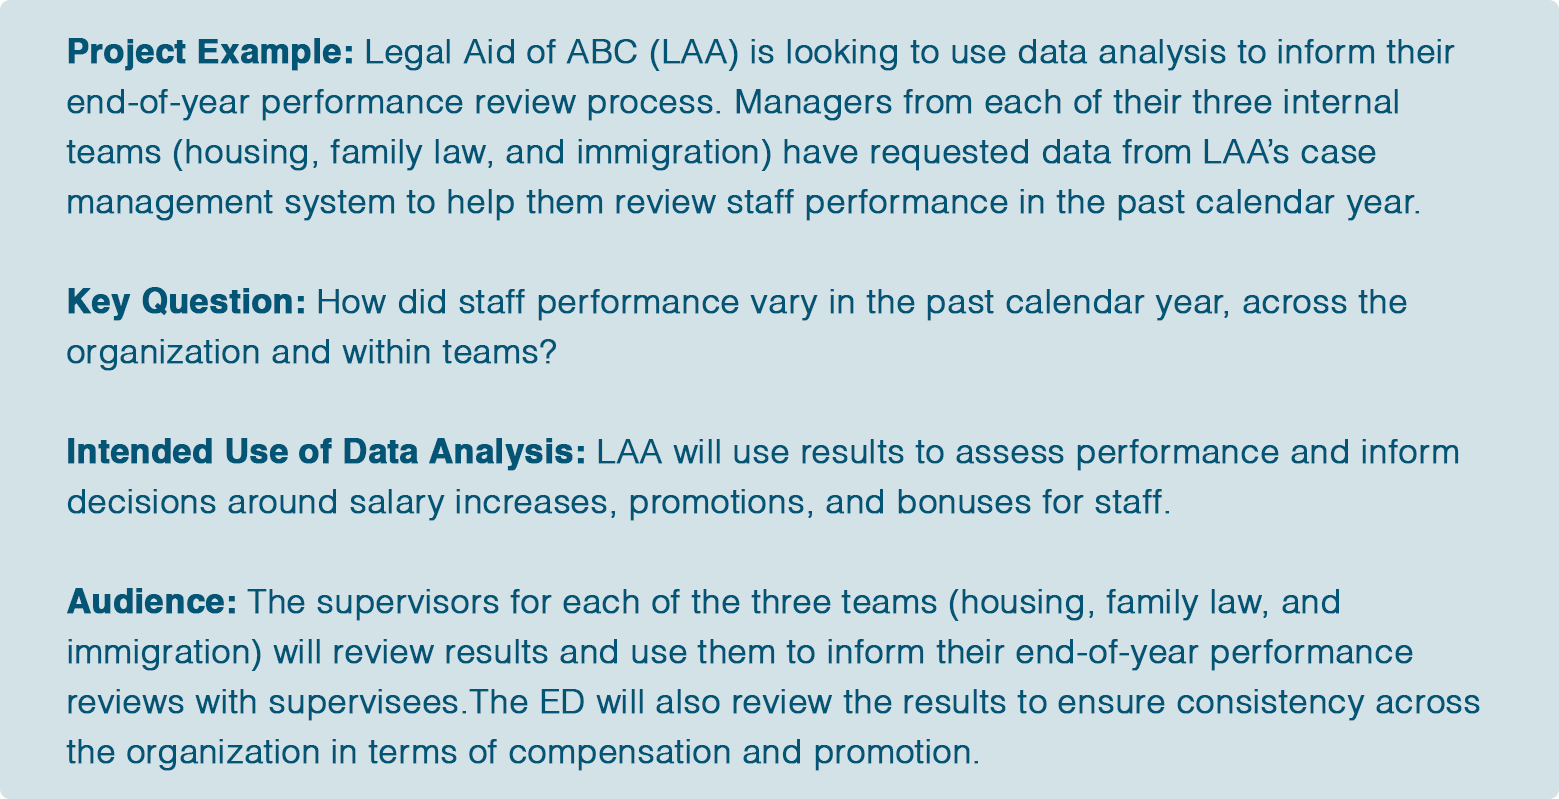
What is the key question behind the analysis?
Data analysis is used to address a particular knowledge gap. The key question articulates this gap by communicating what is hoped to be learned from the data. Data analysis results may be used as the sole basis for answering the key question, or results may be just one input among many to fill this knowledge gap.
The key question needs to be established at the start because it anchors the analysis and informs what datasets, metrics, and analysis techniques will be used. A well-thought-out key question helps avoid unnecessary work, as all other steps of the data analysis project will be crafted specifically to answer it. While this toolkit refers to the “key question” as singular, note that many projects will have more than one key question that will be addressed through the analysis.
It is also important to think through different interpretations of the key question to make sure there is a common understanding among those involved with the project. For example, the question “How many intakes were conducted last year?” could be interpreted differently, as highlighted below:
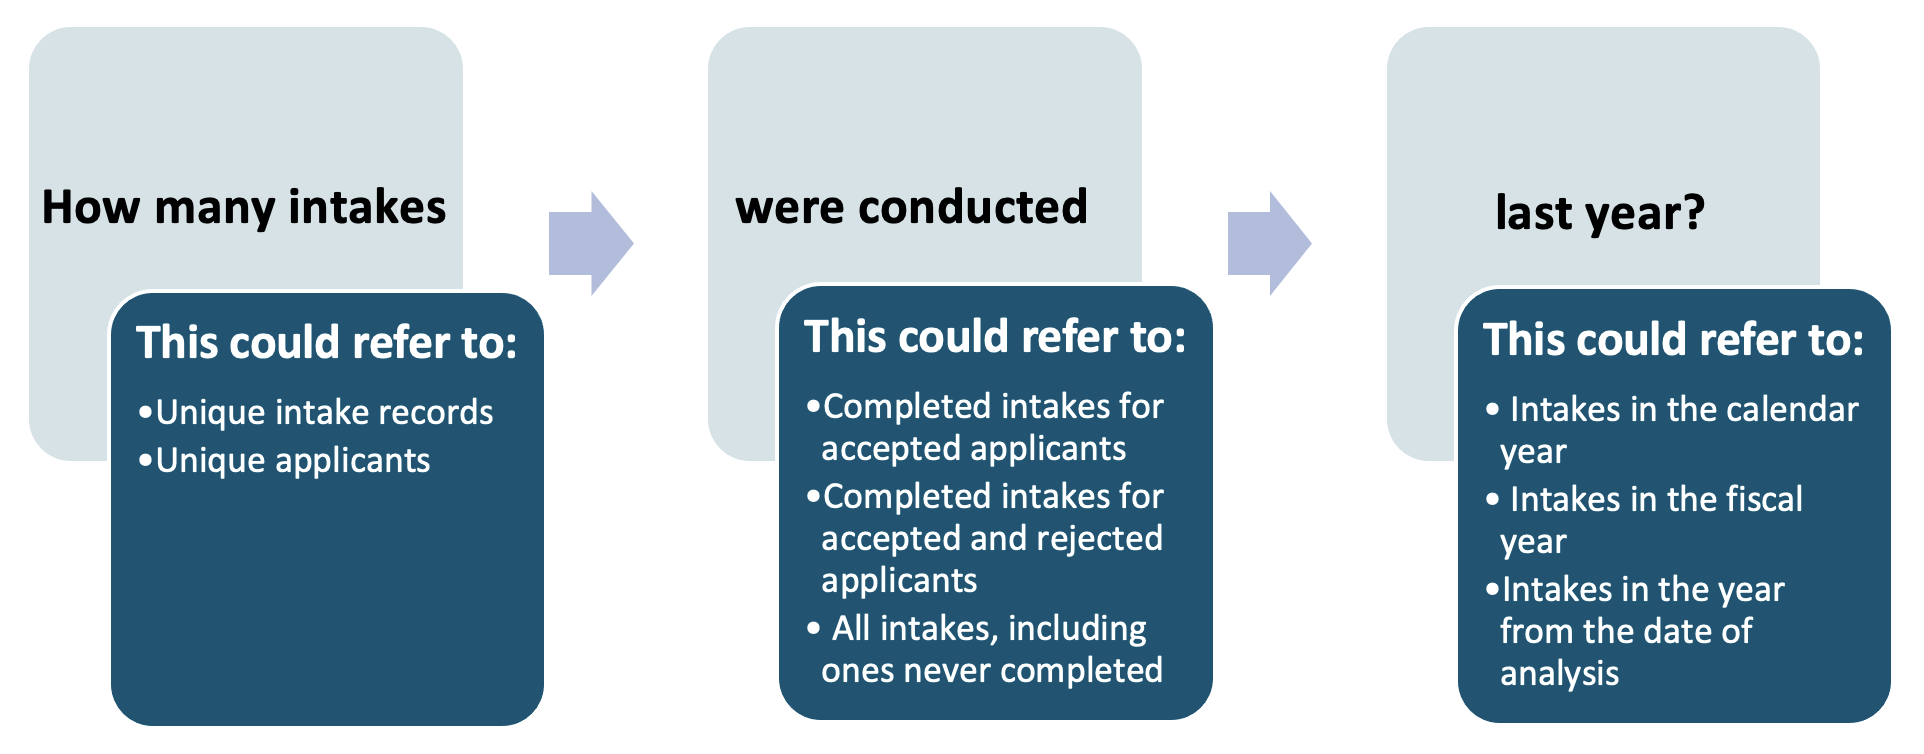
When crafting the key question, make sure to establish clarity around what exactly is being asked to ensure the analysis is tailored appropriately. A clearer version of this same key question could be: “How many unique intake records were started in calendar year 2021?”.
How and by whom will results be used?
How: Data can provide insights into a particular question, but it takes additional planning to decide how to translate insights into actions. Once the purpose of the data analysis project is defined through its key question, consider how the answers to this question will be used. The goal here is to define actionable steps, so the knowledge gained through the analysis can be put to good use.
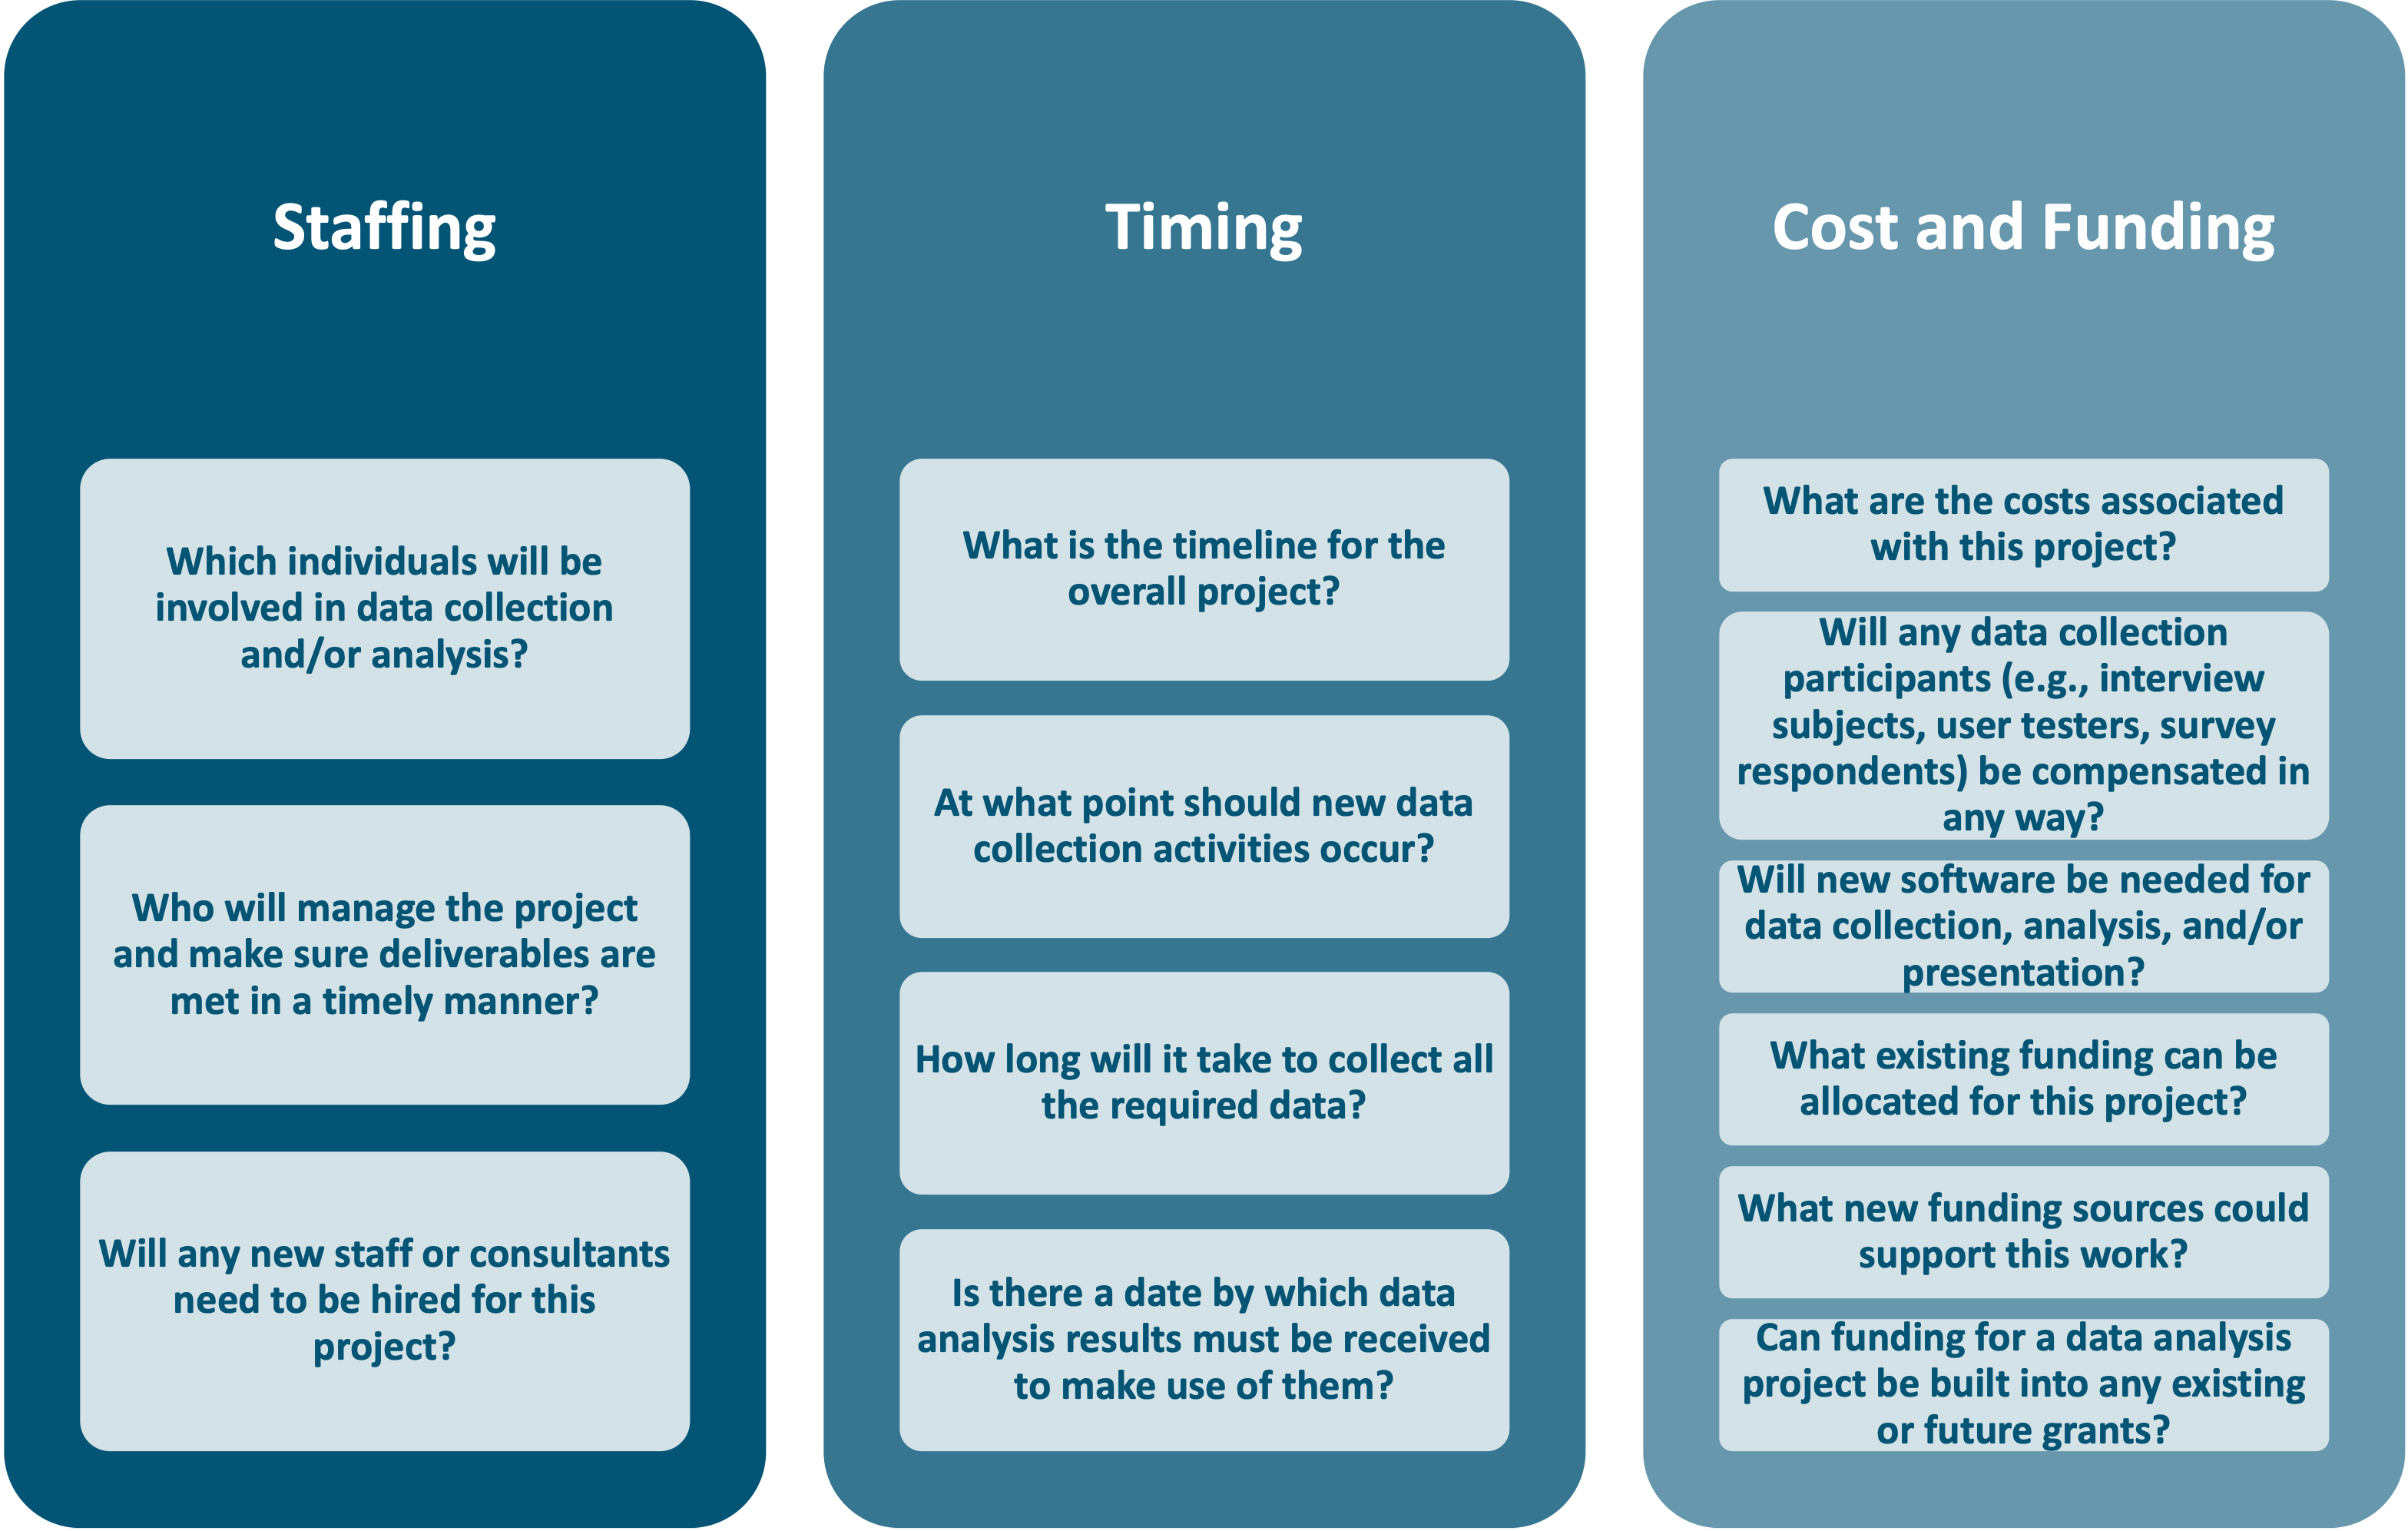
Data analysis projects come with different costs, though there are plenty of free tools, resources, and volunteers that can help to offset these costs. Examples of project costs may include the salary of staff conducting the analysis, the purchase of new software, and the time it takes for participants to complete data collection activities. Defining both the key question AND intended use of the data analysis project helps ensure that investment put into this work pays off. It may also help justify the costs of the project.
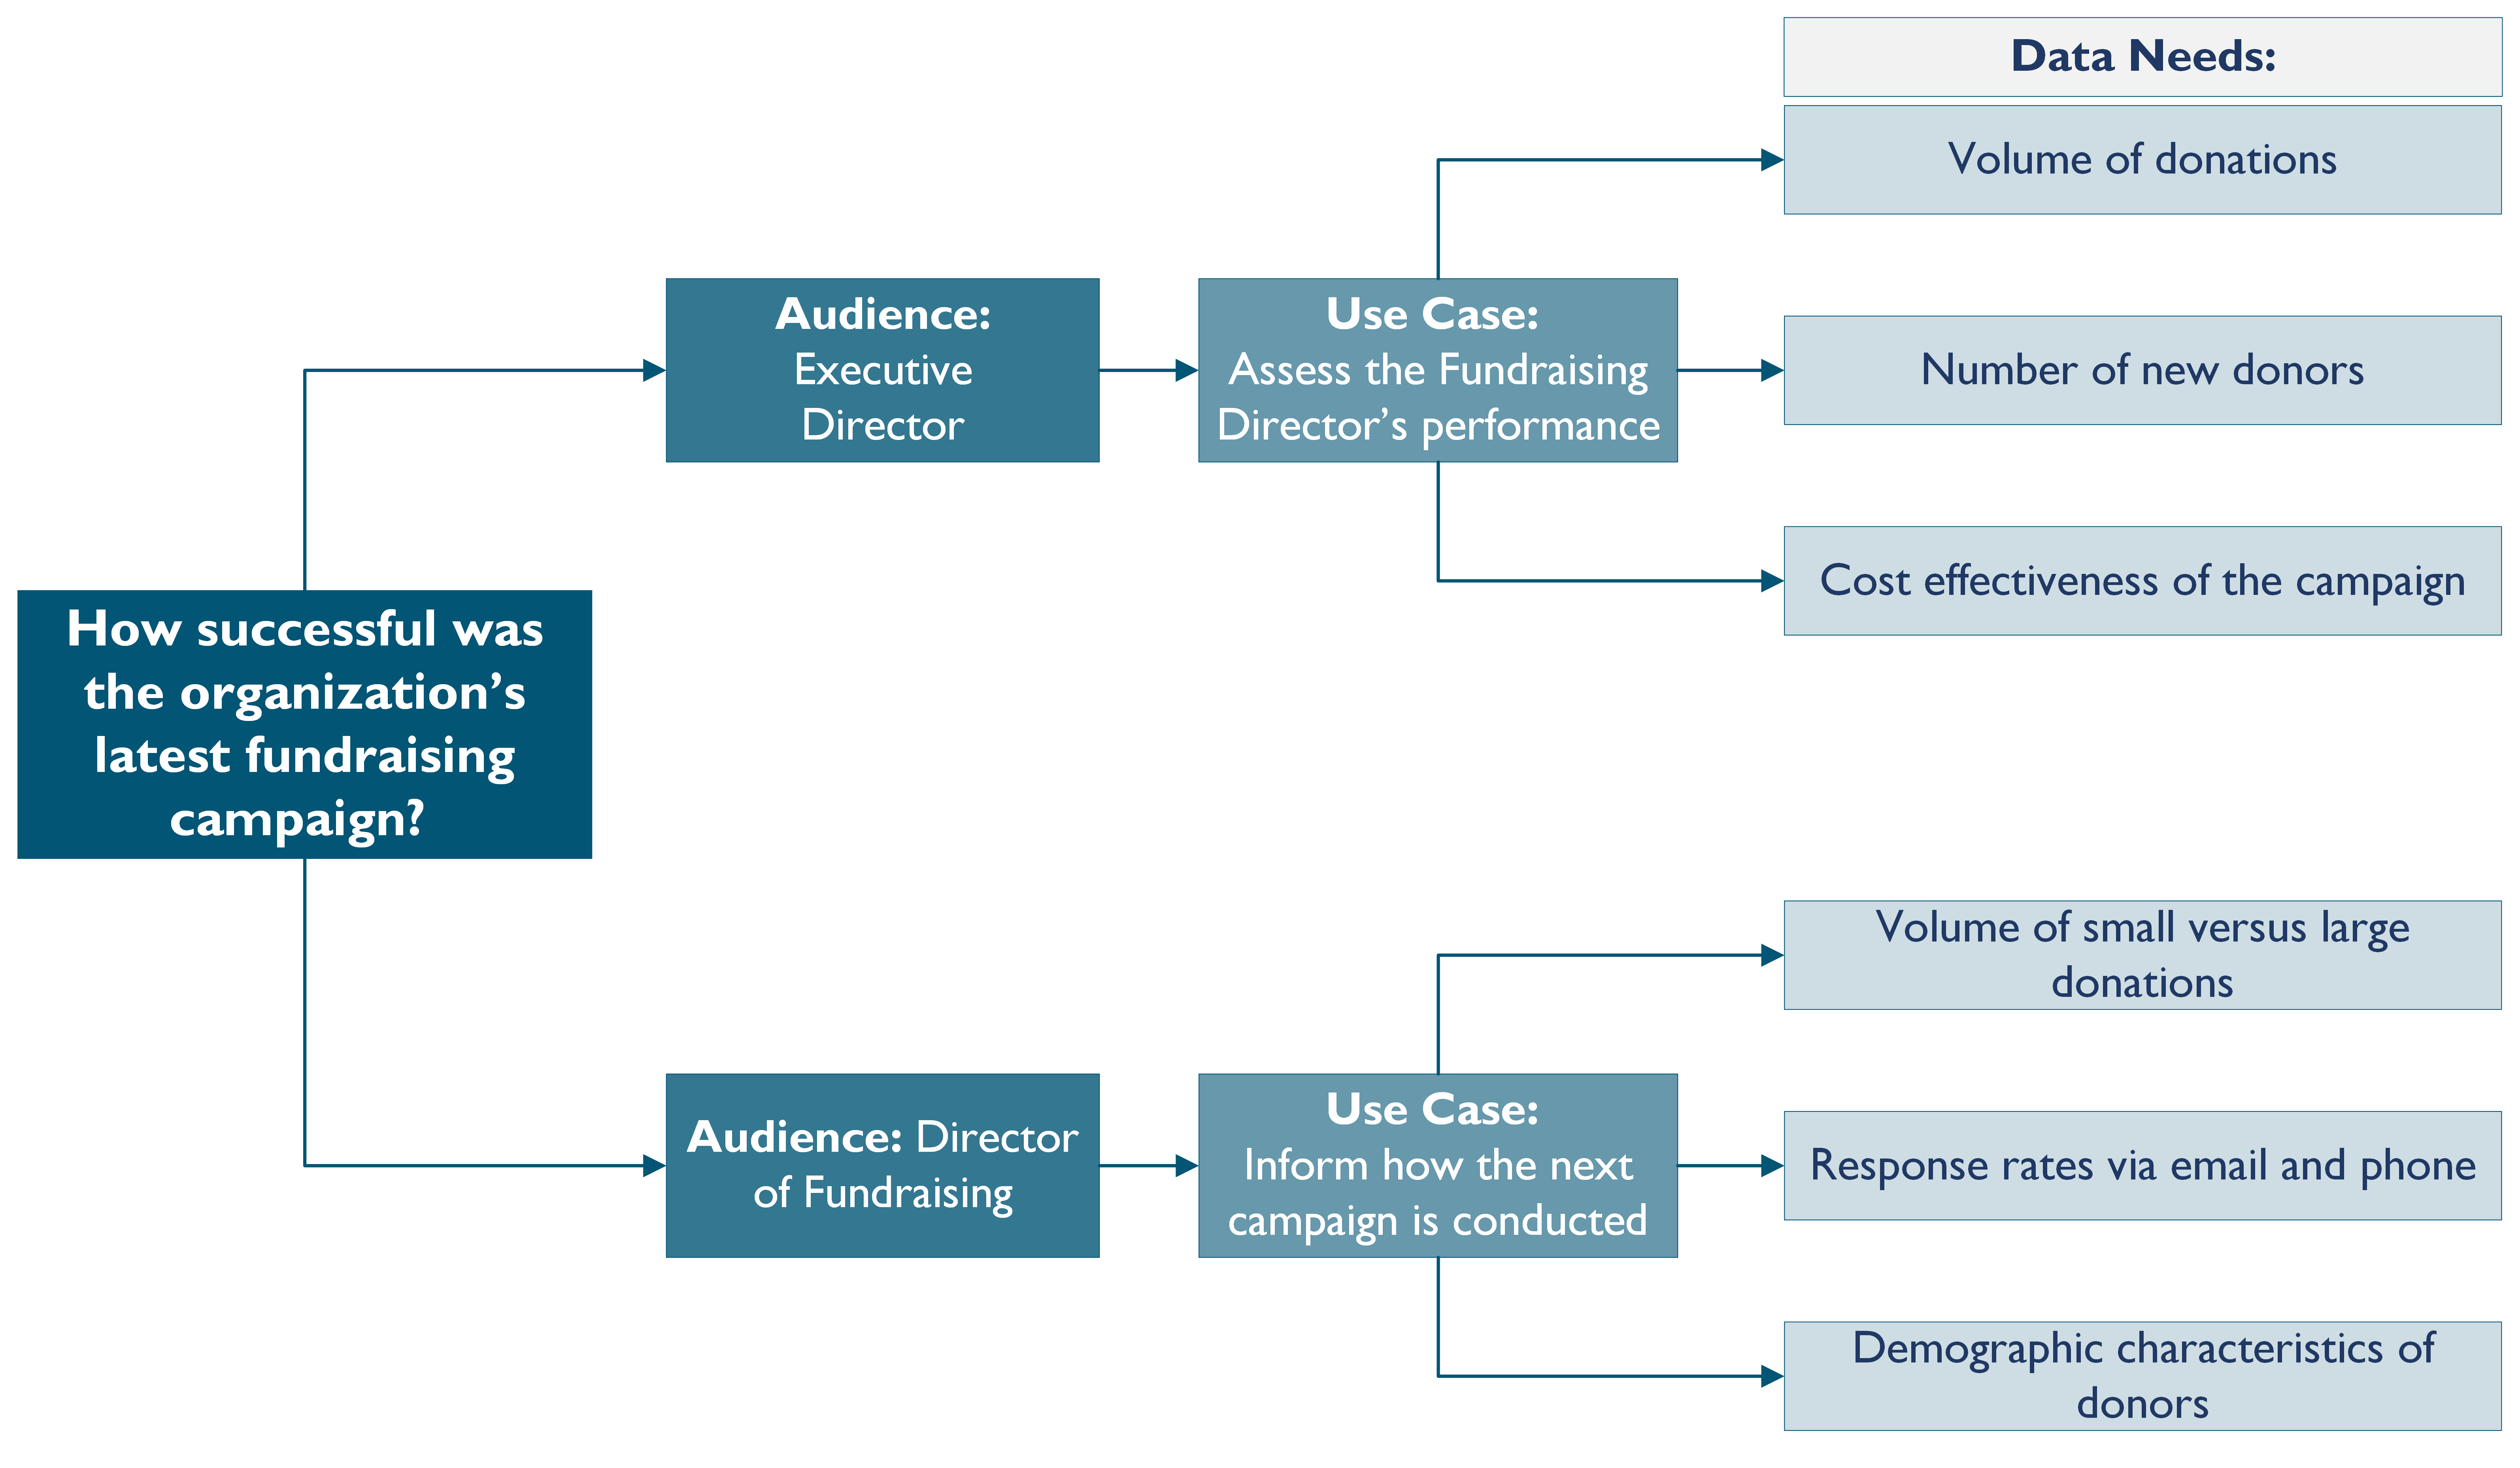
By Whom: It is also important to identify the audience for the analysis. Different audiences may have their own expectations around the metrics and analysis needed to answer identical questions, as expressed in the example below.
An organization’s Director of Fundraising and Executive Director (ED) both ask the same question: How successful was the organization’s latest fundraising campaign? The metrics and use case for this analysis will vary by the intended audience, as displayed here:
Additionally, the person raising the key question and the person who will put results into action are not always the same. For example, a Director of Operations may ask “Is this program cost effective?” but the program’s manager will be the one to adjust the program based on results. This is another reason to take time at the project start to identify the audience; if there are multiple audiences, the analysis will need to be comprehensive enough to be informative for all.
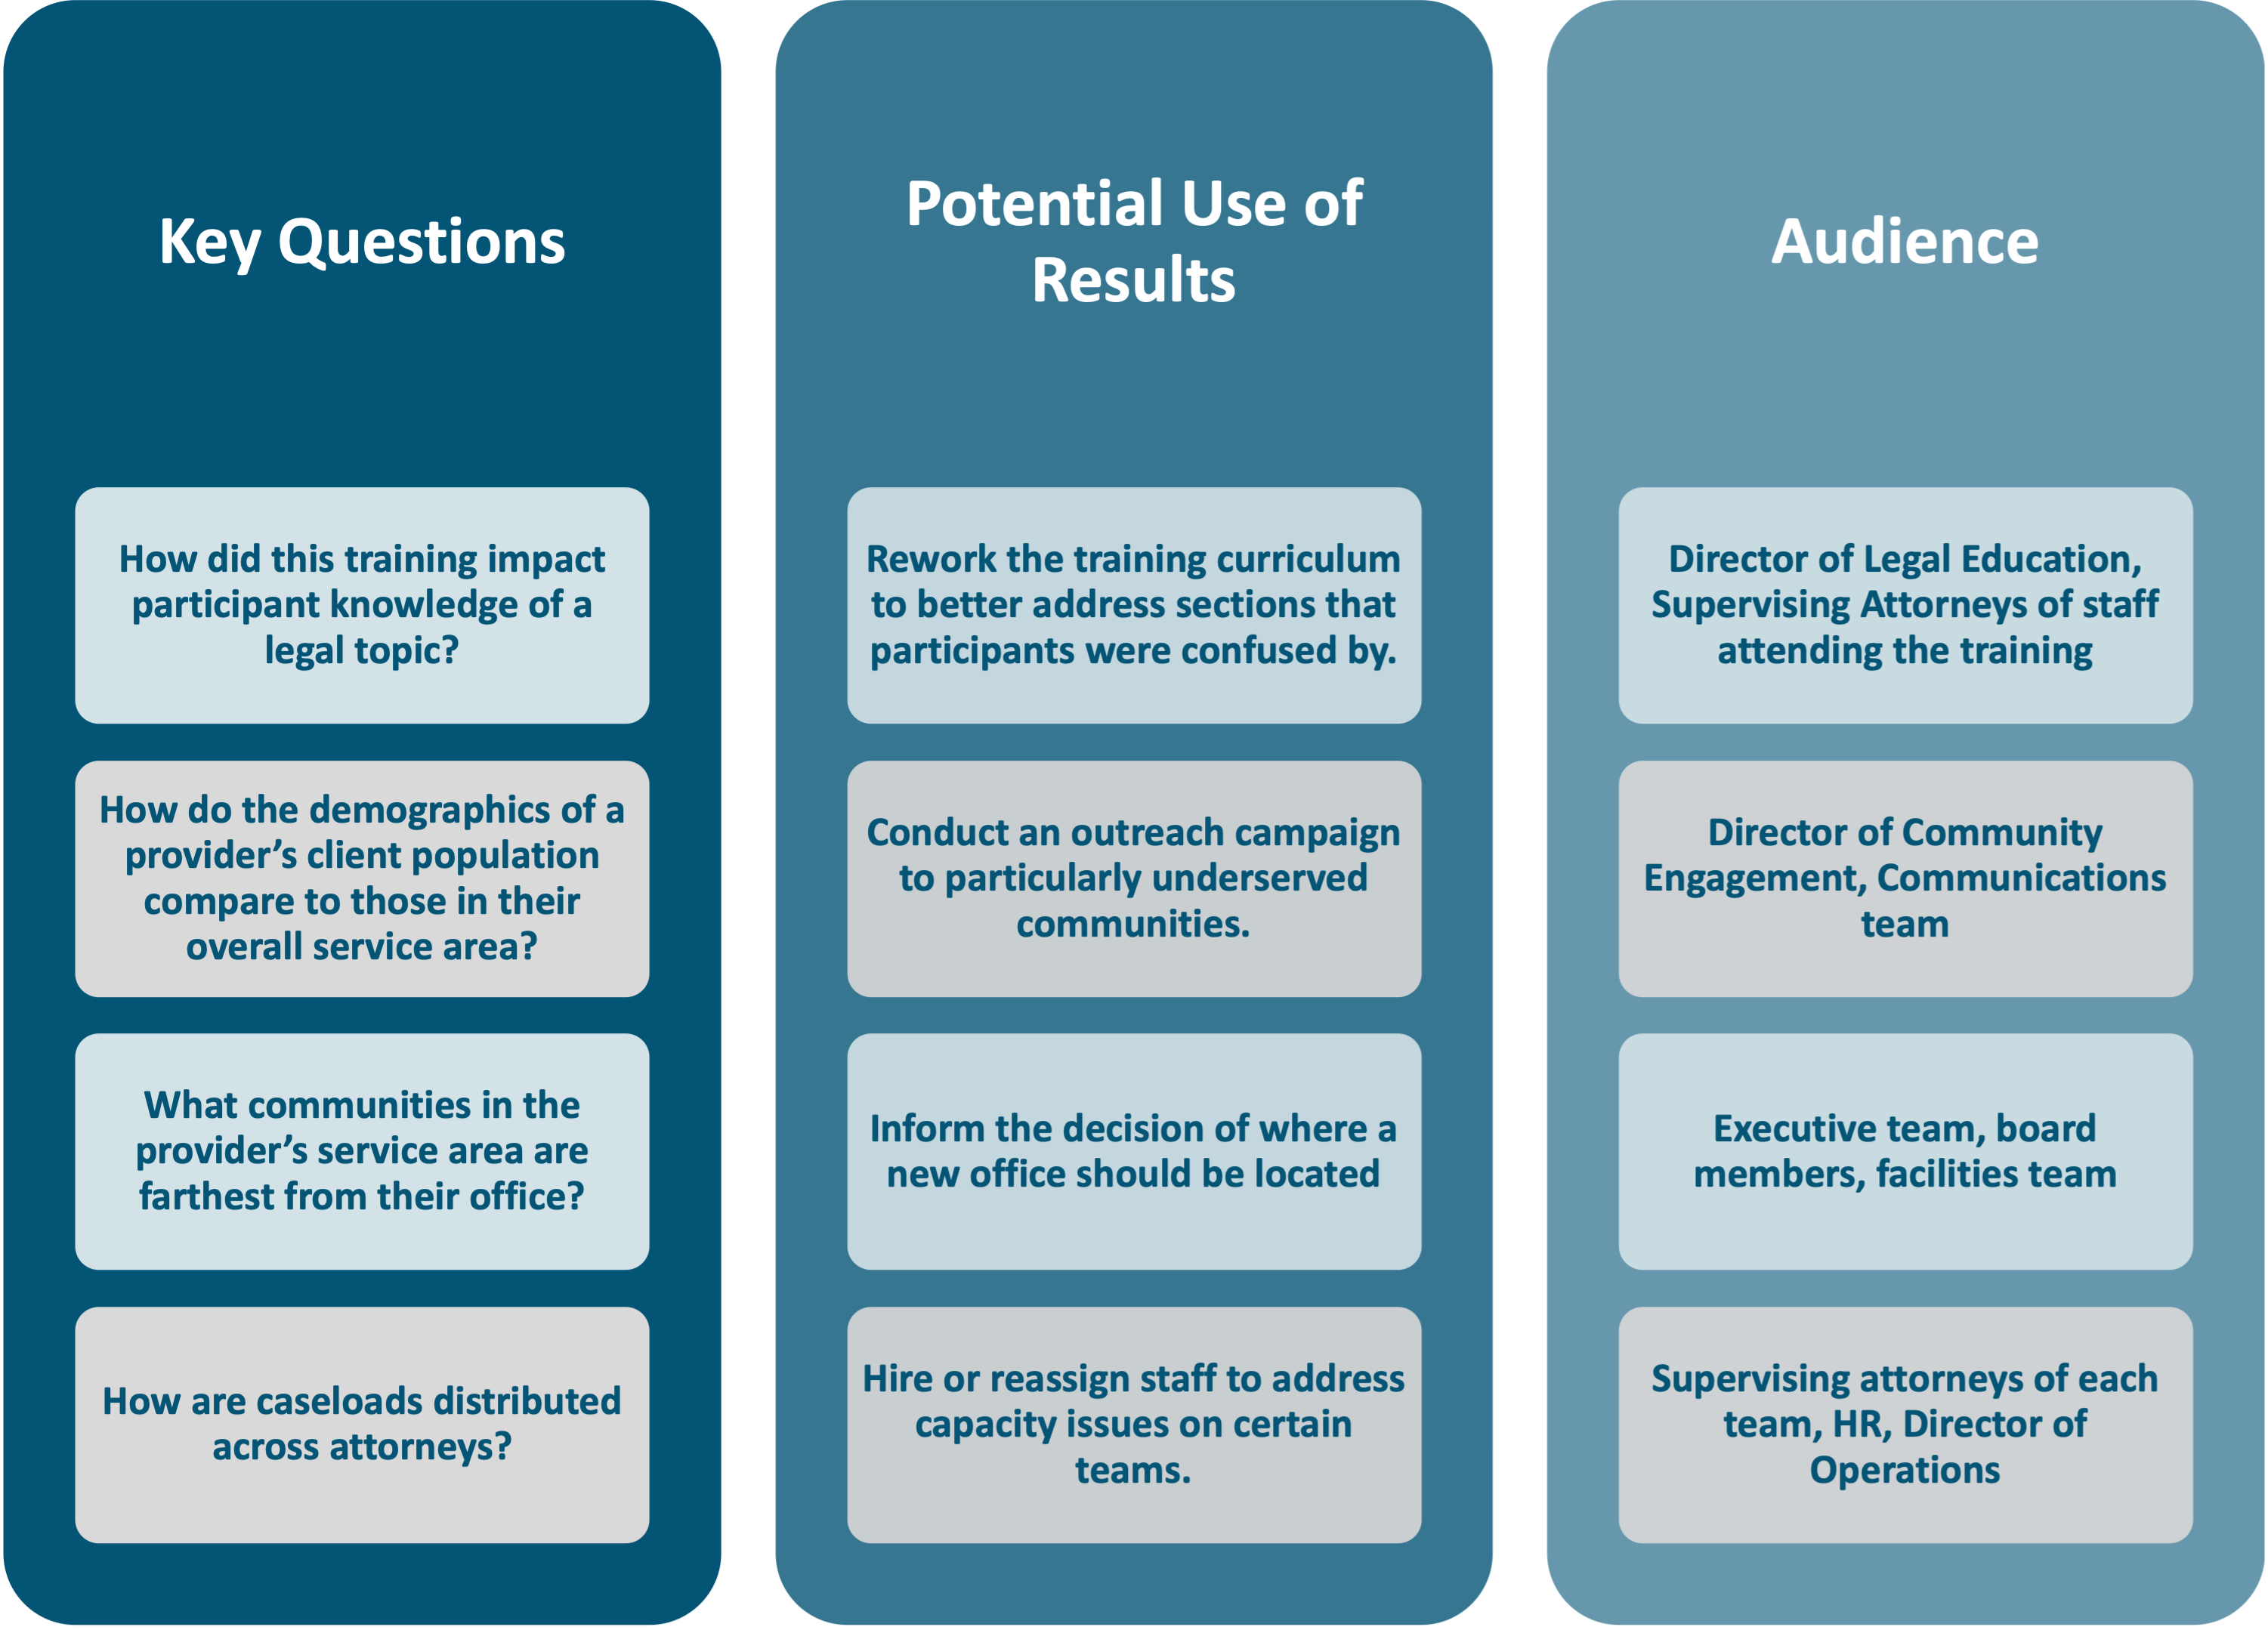
The following chart puts the above pieces together and shows possible uses and audiences for example key questions:
What will be measured?
After finalizing the key question, begin considering what metrics will help to answer it. When thinking about what data to use, keep in mind that a good metric will be:
- Relevant: The metric is meaningful for the analysis and for what the audience hopes to learn.
- Reliable: The metric reflects reality (i.e., a weight scale displays the correct weight).
- Valid: The metric accurately captures what is intended for it to represent.
Beyond these attributes, it can also be helpful to consider the time, cost, and ease associated with collecting this data. Consider if there are any existing datasets that could be used to answer the key question but keep costs down and other cost-effective data collection strategies, such as those compiled by Better Evaluation.
What comes next?
Depending on the project and resources available to the organization, additional logistical questions may need to be answered before the next step, data collection, can begin. Questions to consider include:
Data analysis is often used to answer questions about a particular program or intervention, such as:
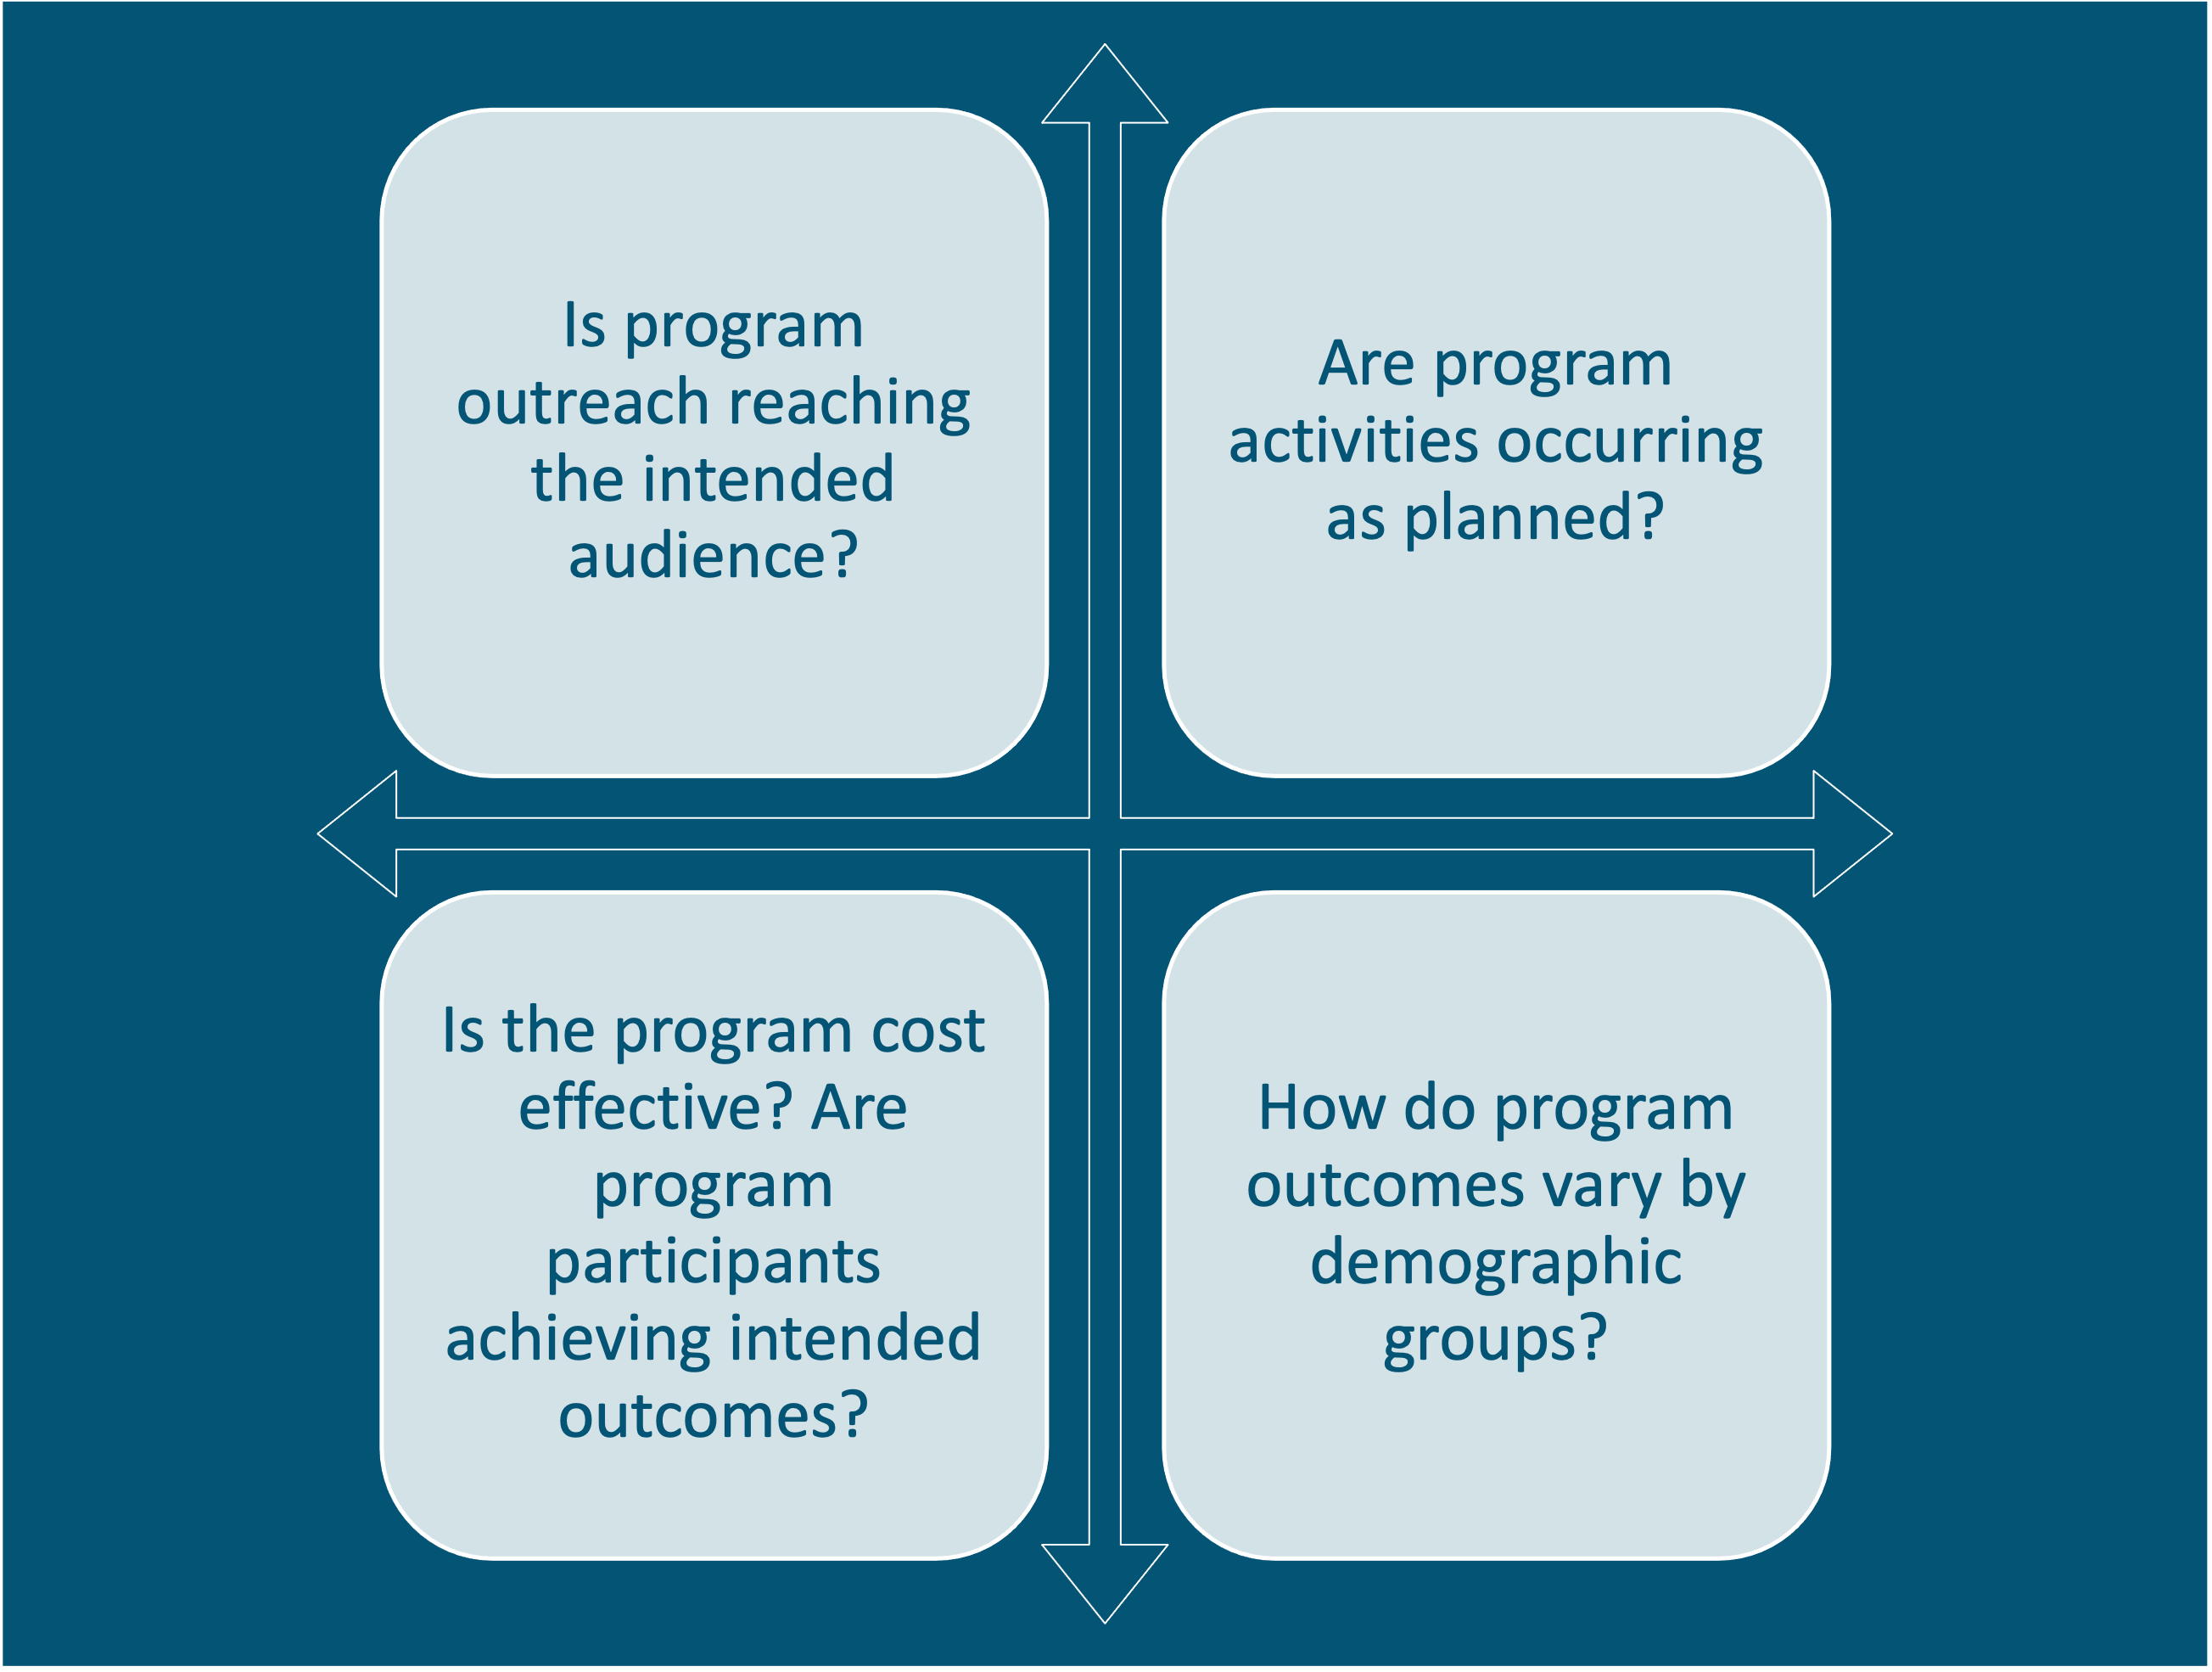
For a data analysis project focused on a particular program, consider creating a “logic model” to establish a common understanding of the program and its associated goals. A logic model documents the inputs, activities, and intended outputs and outcomes of the program. To learn more about logic models, check out the LSNTAP Project Management Toolkit.