
Information graphics or Infographics are graphic representations of data or knowledge, and they are used for a variety of purposes due to their unique ability to present information in an easily understandable and aesthetically pleasing way. Infographics incorporate data and design to tell a story or present complex information. The infographic format simplifies information by creating a visualization that our brains are more likely to understand and remember. They are also more readily shared on social media sites and can be a great way for legal aid organizations to promote their work. Here are some ways legal aid orgs are using infographics:
Illinois Legal Aid Online
Illinois Legal Aid Online (ILAO) created this powerful infographic which demonstrates a correlation between national events and the impact on their organization. Although this could easily be presented as data in a chart, the infographic is more likely to be read and shared with other prospective donors.
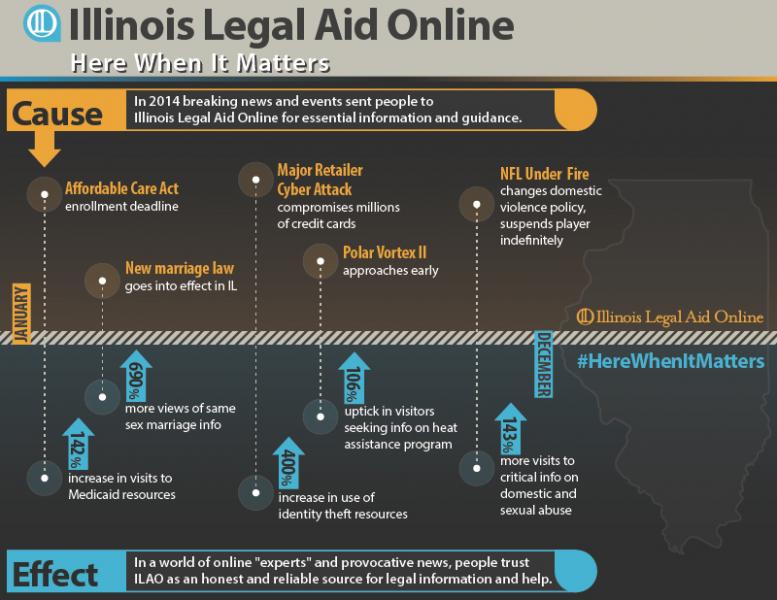
ILAO created this infographic in house using Photoshop & Illustrator.
Empire Justice Center
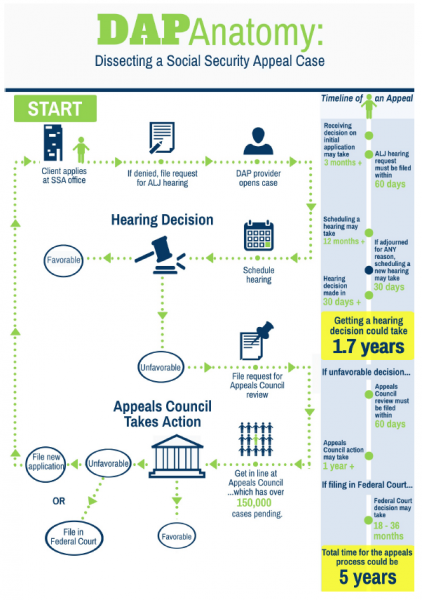
The Empire Justice created a couple of infographics this fall to help more easily explain complex issues. The infographic below was used in their education efforts with state policymakers to more easily explain the steps of a Social Security Appeal. They also developed an infographic for their C.A.S.H (Creating Assets, Savings & Hope) Program, which provide free tax preparation and financial literacy for low-income working families.
The Shriver Center
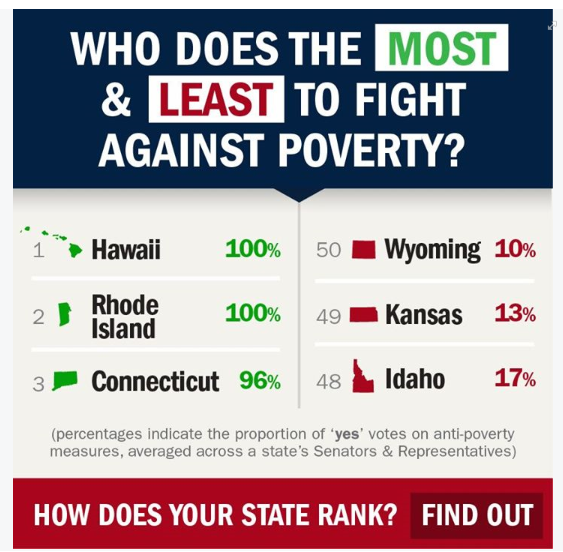
The Shriver has used infograhics for various purposes including fundraising, legislative advocacy, and promoting reports. The infographic below was used to promote The Shriver Center's 2012 Poverty Scorecard which rated state representatives on their efforts to end poverty. The Shriver Center is also running a year-end fundraising campaign on Facebook which includes a series of infographics. Here is another example of an infographic The Shriver Center used for legislative advocacy work.
The Shriver Center uses piktochart.com to create their infographics. They've also used InDesign & Photoshop. . Piktochart has a robust free option which comes with a lot of icons and fully customizable templates. The free version can go a long way, but piktochart.com has a premium version which nonprofits can apply for at $39/year.
The Northwest Consumer Law Center
The NWCLC used this infographic in a newsletter which was handed out to guests at their "friendraiser." The event and the infographic were designed to help raise awareness, celebrate accomplishments, and get the attention of potential donors.
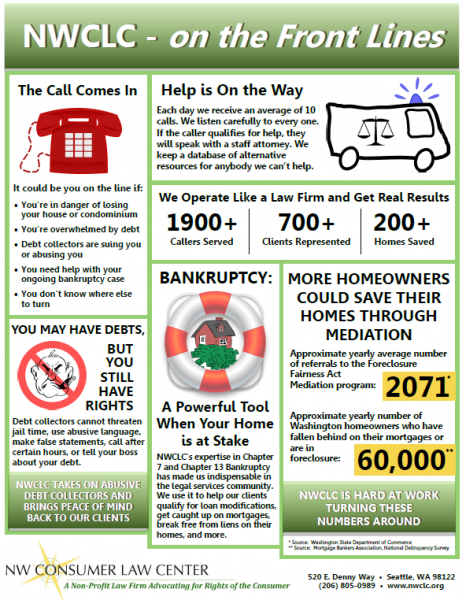
This infographic was created using Microsoft Publisher 2013 with images from pixabay.com. Images were combined and edited with GIMP, a free image editing program.
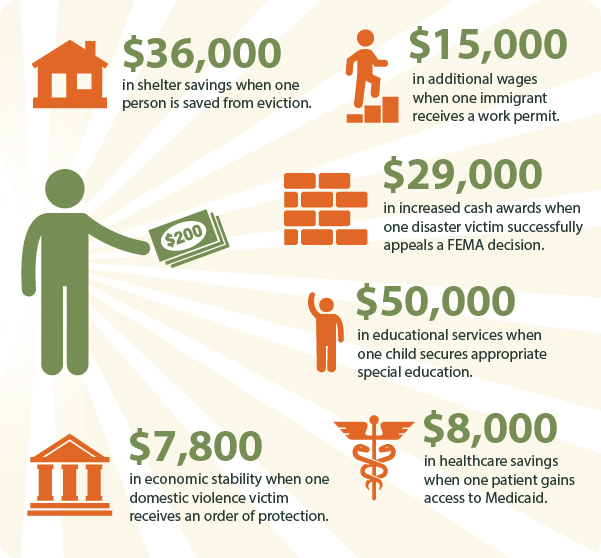
New York Legal Assistance Group
The New York Legal Assistance Group used this infographic to help raise awareness about their work and reach potential donors. The infographic gives a quick visualization of what "Your $200 gift can become."
These are just a handful of ways legal aid organizations are taking advantage of the infographic's unique ability to present information. Please use the comments section to share helpful resources and tell us about how your org is using infographics.
Special Thanks to NYLAG, The Shriver Center, ILAO, NWCLC, & the Empire Justice Center for sharing your infographics with LSNTAP for this post.